|
Download Data (XLS File) |
|
||||||||
|
||||||||
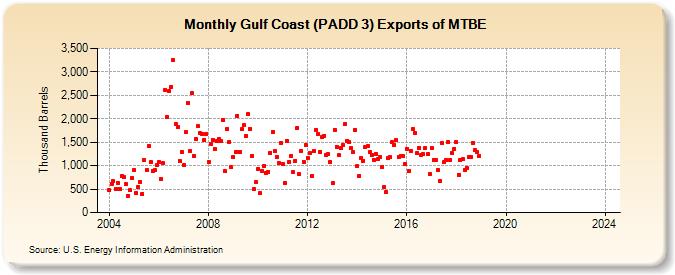
| Gulf Coast (PADD 3) Exports of MTBE (Thousand Barrels) | ||||||||
| Year | Jan | Feb | Mar | Apr | May | Jun | Jul | Aug | Sep | Oct | Nov | Dec |
|---|---|---|---|---|---|---|---|---|---|---|---|---|
| 2004 | 476 | 615 | 665 | 498 | 639 | 510 | 775 | 751 | 604 | 361 | 479 | 732 |
| 2005 | 912 | 414 | 545 | 661 | 406 | 1,112 | 905 | 1,423 | 1,079 | 886 | 904 | 1,004 |
| 2006 | 1,075 | 714 | 1,047 | 2,616 | 2,034 | 2,595 | 2,686 | 3,245 | 1,881 | 1,817 | 1,099 | 1,299 |
| 2007 | 1,017 | 1,707 | 2,342 | 1,309 | 2,539 | 1,214 | 1,566 | 1,840 | 1,691 | 1,677 | 1,546 | 1,675 |
| 2008 | 1,080 | 1,461 | 1,551 | 1,346 | 1,526 | 1,571 | 1,521 | 1,979 | 880 | 1,786 | 1,505 | 963 |
| 2009 | 1,183 | 1,291 | 2,065 | 1,297 | 1,771 | 1,858 | 1,636 | 2,094 | 1,789 | 1,209 | 495 | 646 |
| 2010 | 934 | 416 | 896 | 997 | 854 | 875 | 1,276 | 1,717 | 1,315 | 1,195 | 1,059 | 1,482 |
| 2011 | 1,025 | 637 | 1,536 | 1,088 | 1,216 | 856 | 1,106 | 1,803 | 815 | 1,323 | 1,085 | 1,445 |
| 2012 | 1,169 | 1,275 | 786 | 1,313 | 1,756 | 1,677 | 1,299 | 1,608 | 1,642 | 1,235 | 1,247 | 1,079 |
| 2013 | 624 | 1,769 | 1,403 | 1,227 | 1,371 | 1,443 | 1,878 | 1,526 | 1,499 | 1,368 | 1,285 | 1,770 |
| 2014 | 985 | 789 | 1,159 | 1,106 | 1,390 | 1,411 | 1,284 | 1,237 | 1,129 | 1,253 | 1,136 | 1,179 |
| 2015 | 962 | 548 | 436 | 1,160 | 1,180 | 1,496 | 1,444 | 1,539 | 1,181 | 1,211 | 1,205 | 1,028 |
| 2016 | 1,362 | 895 | 1,308 | 1,773 | 1,693 | 1,276 | 1,382 | 1,223 | 1,246 | 1,379 | 1,245 | 817 |
| 2017 | 1,376 | 1,130 | 1,124 | 914 | 679 | 1,485 | 1,072 | 1,130 | 1,500 | 1,124 | 1,276 | 1,362 |
| 2018 | 1,501 | 810 | 1,116 | 1,136 | 917 | 958 | 1,184 | 1,193 | 1,491 | 1,324 | 1,294 | 1,206 |
| 2019 | -- | -- | -- | -- | -- | -- | -- | -- | -- | -- | -- | -- |
| 2020 | -- | -- | -- | -- | -- | -- | -- | -- | -- | -- | -- | -- |
| 2021 | -- | -- | -- | -- | -- | -- | -- | -- | -- | -- | -- | |
| 2022 | -- | -- | -- | -- | -- | -- | -- | -- | -- | -- | -- | -- |
| 2023 | -- | -- | -- | -- | -- | -- | -- | -- | -- | -- | -- | -- |
| 2024 | -- | |||||||||||
| - = No Data Reported; -- = Not Applicable; NA = Not Available; W = Withheld to avoid disclosure of individual company data. |
| Release Date: 3/29/2024 |
| Next Release Date: 4/30/2024 |