|
Download Data (XLS File) |
|
||||||||
|
||||||||
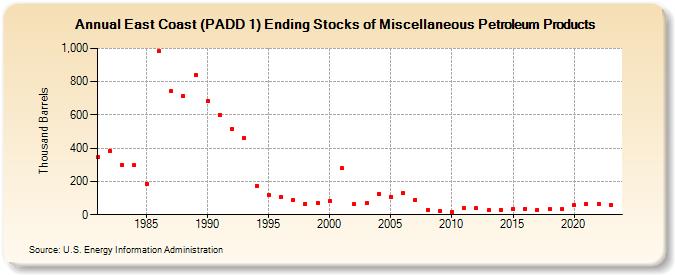
| East Coast (PADD 1) Ending Stocks of Miscellaneous Petroleum Products (Thousand Barrels) | ||||||||
| Decade | Year-0 | Year-1 | Year-2 | Year-3 | Year-4 | Year-5 | Year-6 | Year-7 | Year-8 | Year-9 |
|---|---|---|---|---|---|---|---|---|---|---|
| 1980's | 344 | 381 | 300 | 297 | 187 | 982 | 743 | 714 | 841 | |
| 1990's | 685 | 600 | 516 | 460 | 175 | 118 | 104 | 89 | 66 | 73 |
| 2000's | 82 | 279 | 62 | 68 | 127 | 109 | 128 | 90 | 29 | 20 |
| 2010's | 18 | 38 | 38 | 26 | 31 | 37 | 37 | 29 | 34 | 33 |
| 2020's | 57 | 67 | 66 | 60 |
| - = No Data Reported; -- = Not Applicable; NA = Not Available; W = Withheld to avoid disclosure of individual company data. |
| Release Date: 8/30/2024 |
| Next Release Date: 8/29/2025 |