|
Download Data (XLS File) |
|
||||||||
|
||||||||
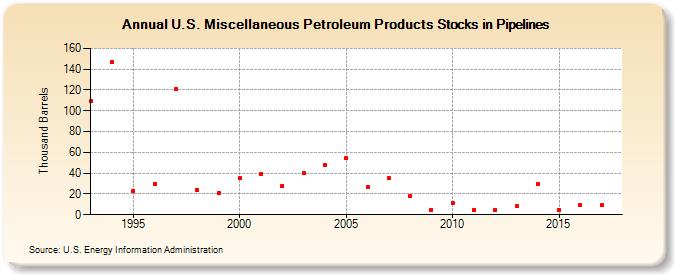
| U.S. Miscellaneous Petroleum Products Stocks in Pipelines (Thousand Barrels) | ||||||||
| Decade | Year-0 | Year-1 | Year-2 | Year-3 | Year-4 | Year-5 | Year-6 | Year-7 | Year-8 | Year-9 |
|---|---|---|---|---|---|---|---|---|---|---|
| 1990's | 109 | 147 | 23 | 30 | 121 | 24 | 21 | |||
| 2000's | 35 | 39 | 28 | 40 | 48 | 55 | 27 | 35 | 18 | 5 |
| 2010's | 11 | 5 | 5 | 8 | 30 | 5 | 9 | 9 |
| - = No Data Reported; -- = Not Applicable; NA = Not Available; W = Withheld to avoid disclosure of individual company data. |
| Release Date: 3/29/2024 |
| Next Release Date: 8/30/2024 |