|
Download Data (XLS File) |
|
||||||||
|
||||||||
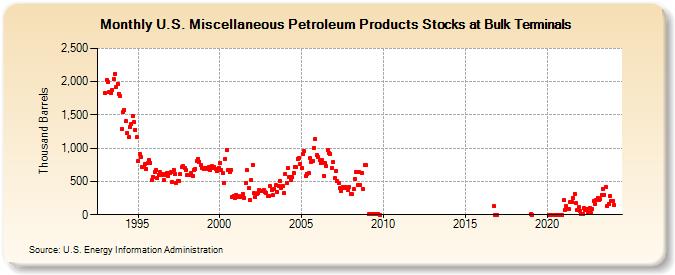
| U.S. Miscellaneous Petroleum Products Stocks at Bulk Terminals (Thousand Barrels) | ||||||||
| Year | Jan | Feb | Mar | Apr | May | Jun | Jul | Aug | Sep | Oct | Nov | Dec |
|---|---|---|---|---|---|---|---|---|---|---|---|---|
| 1993 | 1,829 | 2,030 | 1,997 | 1,837 | 1,831 | 1,882 | 2,036 | 2,119 | 1,919 | 1,967 | 1,821 | 1,787 |
| 1994 | 1,292 | 1,543 | 1,575 | 1,403 | 1,234 | 1,161 | 1,324 | 1,358 | 1,482 | 1,395 | 1,279 | 1,161 |
| 1995 | 809 | 915 | 864 | 716 | 720 | 763 | 690 | 773 | 825 | 778 | 519 | 573 |
| 1996 | 646 | 675 | 545 | 601 | 639 | 601 | 618 | 522 | 594 | 624 | 580 | 620 |
| 1997 | 642 | 489 | 679 | 618 | 483 | 502 | 505 | 606 | 714 | 727 | 708 | 674 |
| 1998 | 591 | 597 | 595 | 630 | 588 | 677 | 693 | 804 | 844 | 799 | 740 | 703 |
| 1999 | 689 | 706 | 696 | 694 | 718 | 671 | 728 | 695 | 716 | 691 | 660 | 705 |
| 2000 | 781 | 678 | 625 | 482 | 844 | 970 | 672 | 645 | 673 | 271 | 283 | 250 |
| 2001 | 301 | 284 | 272 | 265 | 279 | 312 | 254 | 476 | 668 | 398 | 227 | 519 |
| 2002 | 751 | 319 | 260 | 304 | 319 | 377 | 361 | 354 | 374 | 344 | 332 | 288 |
| 2003 | 287 | 427 | 375 | 291 | 385 | 442 | 348 | 431 | 511 | 407 | 438 | 324 |
| 2004 | 618 | 484 | 703 | 568 | 516 | 564 | 634 | 724 | 710 | 842 | 853 | 769 |
| 2005 | 697 | 912 | 952 | 577 | 619 | 623 | 848 | 796 | 806 | 1,009 | 1,141 | 892 |
| 2006 | 860 | 822 | 777 | 821 | 588 | 780 | 727 | 967 | 933 | 915 | 703 | 792 |
| 2007 | 547 | 657 | 507 | 481 | 401 | 351 | 423 | 403 | 420 | 397 | 378 | 416 |
| 2008 | 316 | 307 | 380 | 541 | 644 | 444 | 649 | 449 | 633 | 388 | 744 | 743 |
| 2009 | 5 | 4 | 4 | 6 | 5 | 5 | 5 | 5 | 3 | |||
| 2011 | 19 | |||||||||||
| 2014 | 3 | 2 | ||||||||||
| 2016 | 126 | 1 | 1 | |||||||||
| 2019 | 7 | 0 | ||||||||||
| 2020 | 1 | 2 | 1 | 2 | 2 | 2 | 2 | 2 | 2 | |||
| 2021 | 219 | 77 | 131 | 87 | 81 | 191 | 194 | 252 | 317 | 169 | 73 | 113 |
| 2022 | 60 | 9 | 8 | 97 | 65 | 87 | 38 | 102 | 22 | 89 | 203 | 159 |
| 2023 | 219 | 253 | 219 | 232 | 303 | 394 | 303 | 417 | 133 | 167 | 278 | 207 |
| 2024 | 208 | |||||||||||
| - = No Data Reported; -- = Not Applicable; NA = Not Available; W = Withheld to avoid disclosure of individual company data. |
| Release Date: 3/29/2024 |
| Next Release Date: 4/30/2024 |