|
Download Data (XLS File) |
|
||||||||
|
||||||||
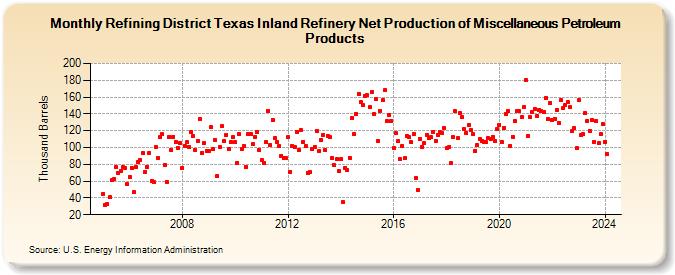
| Refining District Texas Inland Refinery Net Production of Miscellaneous Petroleum Products (Thousand Barrels) | ||||||||
| Year | Jan | Feb | Mar | Apr | May | Jun | Jul | Aug | Sep | Oct | Nov | Dec |
|---|---|---|---|---|---|---|---|---|---|---|---|---|
| 2005 | 45 | 32 | 33 | 41 | 61 | 63 | 77 | 70 | 72 | 77 | 76 | 56 |
| 2006 | 65 | 76 | 47 | 77 | 83 | 85 | 93 | 71 | 77 | 94 | 60 | 59 |
| 2007 | 101 | 88 | 112 | 116 | 79 | 59 | 113 | 97 | 113 | 107 | 99 | 105 |
| 2008 | 76 | 102 | 106 | 101 | 118 | 114 | 97 | 108 | 134 | 94 | 105 | 96 |
| 2009 | 96 | 124 | 98 | 109 | 66 | 101 | 125 | 108 | 115 | 98 | 106 | 112 |
| 2010 | 106 | 82 | 116 | 98 | 102 | 77 | 116 | 116 | 104 | 113 | 118 | 97 |
| 2011 | 85 | 81 | 106 | 144 | 103 | 133 | 111 | 106 | 102 | 90 | 87 | 87 |
| 2012 | 112 | 71 | 102 | 100 | 119 | 97 | 121 | 107 | 102 | 70 | 71 | 98 |
| 2013 | 101 | 120 | 96 | 109 | 115 | 97 | 114 | 112 | 88 | 79 | 86 | 72 |
| 2014 | 86 | 35 | 76 | 73 | 88 | 135 | 116 | 140 | 164 | 154 | 151 | 161 |
| 2015 | 162 | 148 | 166 | 140 | 158 | 108 | 144 | 156 | 168 | 131 | 139 | 132 |
| 2016 | 99 | 117 | 108 | 86 | 102 | 87 | 114 | 112 | 106 | 116 | 64 | 50 |
| 2017 | 110 | 101 | 105 | 115 | 111 | 112 | 119 | 108 | 115 | 118 | 117 | 123 |
| 2018 | 99 | 100 | 81 | 112 | 143 | 111 | 141 | 136 | 122 | 117 | 127 | 121 |
| 2019 | 116 | 96 | 103 | 110 | 108 | 107 | 106 | 111 | 110 | 113 | 108 | 122 |
| 2020 | 127 | 106 | 123 | 140 | 143 | 102 | 113 | 131 | 143 | 143 | 136 | 148 |
| 2021 | 180 | 114 | 136 | 142 | 146 | 137 | 145 | 143 | 142 | 159 | 134 | 153 |
| 2022 | 133 | 134 | 145 | 129 | 156 | 147 | 151 | 154 | 148 | 120 | 123 | 99 |
| 2023 | 156 | 115 | 116 | 141 | 132 | 120 | 133 | 107 | 132 | 105 | 116 | 128 |
| 2024 | 107 | |||||||||||
| - = No Data Reported; -- = Not Applicable; NA = Not Available; W = Withheld to avoid disclosure of individual company data. |
| Release Date: 3/29/2024 |
| Next Release Date: 4/30/2024 |