|
Download Data (XLS File) |
|
||||||||
|
||||||||
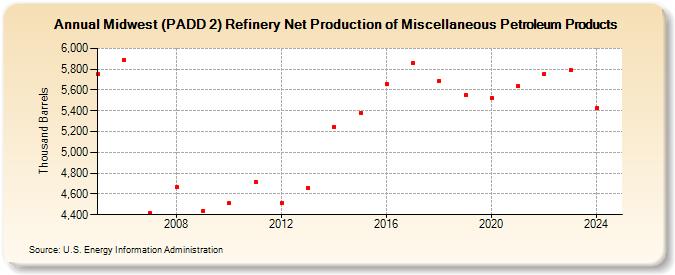
| Midwest (PADD 2) Refinery Net Production of Miscellaneous Petroleum Products (Thousand Barrels) | ||||||||
| Decade | Year-0 | Year-1 | Year-2 | Year-3 | Year-4 | Year-5 | Year-6 | Year-7 | Year-8 | Year-9 |
|---|---|---|---|---|---|---|---|---|---|---|
| 2000's | 5,753 | 5,886 | 4,415 | 4,663 | 4,440 | |||||
| 2010's | 4,511 | 4,718 | 4,515 | 4,659 | 5,244 | 5,380 | 5,657 | 5,860 | 5,688 | 5,551 |
| 2020's | 5,527 | 5,638 | 5,757 | 5,792 |
| - = No Data Reported; -- = Not Applicable; NA = Not Available; W = Withheld to avoid disclosure of individual company data. |
| Release Date: 3/29/2024 |
| Next Release Date: 8/30/2024 |