|
Download Data (XLS File) |
|
||||||||
|
||||||||
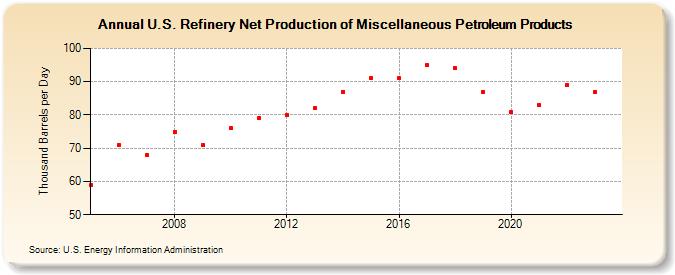
| U.S. Refinery Net Production of Miscellaneous Petroleum Products (Thousand Barrels per Day) | ||||||||
| Decade | Year-0 | Year-1 | Year-2 | Year-3 | Year-4 | Year-5 | Year-6 | Year-7 | Year-8 | Year-9 |
|---|---|---|---|---|---|---|---|---|---|---|
| 2000's | 59 | 71 | 68 | 75 | 71 | |||||
| 2010's | 76 | 79 | 80 | 82 | 87 | 91 | 91 | 95 | 94 | 87 |
| 2020's | 81 | 83 | 89 | 87 |
| - = No Data Reported; -- = Not Applicable; NA = Not Available; W = Withheld to avoid disclosure of individual company data. |
| Release Date: 3/29/2024 |
| Next Release Date: 8/30/2024 |