|
Download Data (XLS File) |
|
||||||||
|
||||||||
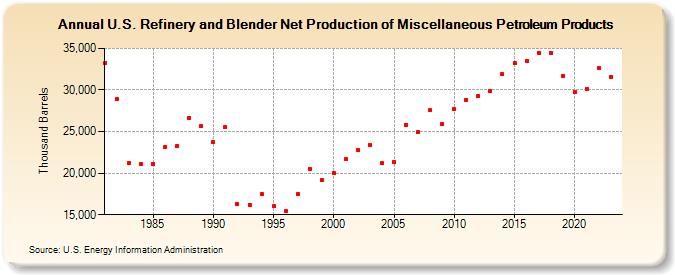
| U.S. Refinery and Blender Net Production of Miscellaneous Petroleum Products (Thousand Barrels) | ||||||||
| Decade | Year-0 | Year-1 | Year-2 | Year-3 | Year-4 | Year-5 | Year-6 | Year-7 | Year-8 | Year-9 |
|---|---|---|---|---|---|---|---|---|---|---|
| 1980's | 33,189 | 28,913 | 21,161 | 21,079 | 21,125 | 23,175 | 23,273 | 26,663 | 25,648 | |
| 1990's | 23,703 | 25,544 | 16,301 | 16,169 | 17,505 | 16,010 | 15,412 | 17,507 | 20,506 | 19,173 |
| 2000's | 19,957 | 21,644 | 22,808 | 23,420 | 21,172 | 21,366 | 25,819 | 24,916 | 27,538 | 25,941 |
| 2010's | 27,672 | 28,854 | 29,261 | 29,828 | 31,907 | 33,248 | 33,447 | 34,505 | 34,404 | 31,740 |
| 2020's | 29,807 | 30,123 | 32,594 | 31,597 |
| - = No Data Reported; -- = Not Applicable; NA = Not Available; W = Withheld to avoid disclosure of individual company data. |
| Release Date: 3/29/2024 |
| Next Release Date: 8/30/2024 |