|
Download Data (XLS File) |
|
||||||||
|
||||||||
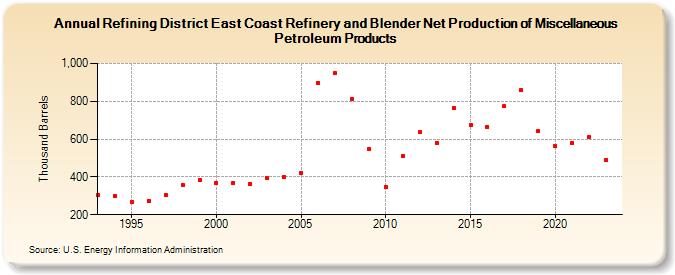
| Refining District East Coast Refinery and Blender Net Production of Miscellaneous Petroleum Products (Thousand Barrels) | ||||||||
| Decade | Year-0 | Year-1 | Year-2 | Year-3 | Year-4 | Year-5 | Year-6 | Year-7 | Year-8 | Year-9 |
|---|---|---|---|---|---|---|---|---|---|---|
| 1990's | 304 | 301 | 269 | 274 | 305 | 358 | 383 | |||
| 2000's | 368 | 367 | 365 | 392 | 401 | 421 | 899 | 949 | 811 | 546 |
| 2010's | 348 | 511 | 635 | 580 | 764 | 676 | 666 | 775 | 858 | 642 |
| 2020's | 561 | 577 | 611 | 492 |
| - = No Data Reported; -- = Not Applicable; NA = Not Available; W = Withheld to avoid disclosure of individual company data. |
| Release Date: 8/30/2024 |
| Next Release Date: 8/29/2025 |