|
Download Data (XLS File) |
|
||||||||
|
||||||||
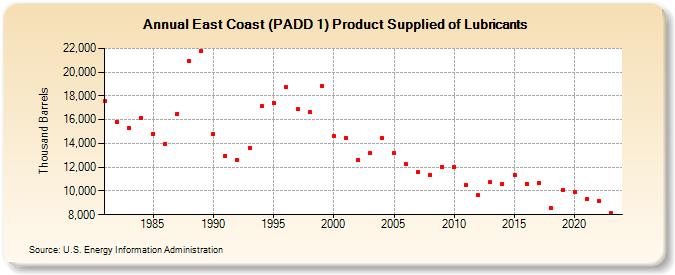
| East Coast (PADD 1) Product Supplied of Lubricants (Thousand Barrels) | ||||||||
| Decade | Year-0 | Year-1 | Year-2 | Year-3 | Year-4 | Year-5 | Year-6 | Year-7 | Year-8 | Year-9 |
|---|---|---|---|---|---|---|---|---|---|---|
| 1980's | 17,594 | 15,841 | 15,322 | 16,145 | 14,836 | 13,980 | 16,512 | 20,980 | 21,812 | |
| 1990's | 14,791 | 12,965 | 12,607 | 13,634 | 17,158 | 17,426 | 18,764 | 16,875 | 16,650 | 18,819 |
| 2000's | 14,632 | 14,499 | 12,637 | 13,153 | 14,436 | 13,213 | 12,243 | 11,583 | 11,376 | 12,044 |
| 2010's | 12,058 | 10,516 | 9,640 | 10,721 | 10,614 | 11,343 | 10,620 | 10,698 | 8,558 | 10,095 |
| 2020's | 9,918 | 9,294 | 9,195 | 8,111 |
| - = No Data Reported; -- = Not Applicable; NA = Not Available; W = Withheld to avoid disclosure of individual company data. |
| Release Date: 8/30/2024 |
| Next Release Date: 8/29/2025 |