|
Download Data (XLS File) |
|
||||||||
|
||||||||
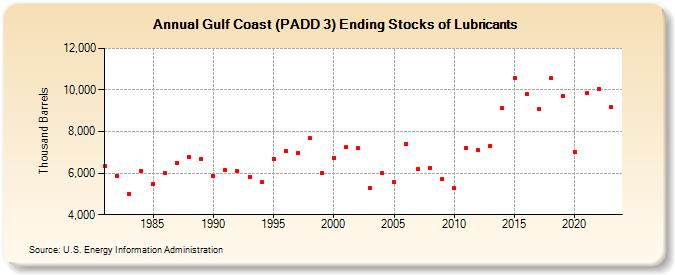
| Gulf Coast (PADD 3) Ending Stocks of Lubricants (Thousand Barrels) | ||||||||
| Decade | Year-0 | Year-1 | Year-2 | Year-3 | Year-4 | Year-5 | Year-6 | Year-7 | Year-8 | Year-9 |
|---|---|---|---|---|---|---|---|---|---|---|
| 1980's | 6,327 | 5,857 | 5,013 | 6,125 | 5,501 | 5,993 | 6,510 | 6,759 | 6,670 | |
| 1990's | 5,862 | 6,134 | 6,081 | 5,835 | 5,570 | 6,693 | 7,073 | 6,973 | 7,686 | 5,984 |
| 2000's | 6,744 | 7,235 | 7,192 | 5,305 | 5,983 | 5,578 | 7,418 | 6,198 | 6,270 | 5,709 |
| 2010's | 5,271 | 7,212 | 7,090 | 7,318 | 9,124 | 10,565 | 9,828 | 9,061 | 10,558 | 9,696 |
| 2020's | 7,032 | 9,846 | 10,058 | 9,159 |
| - = No Data Reported; -- = Not Applicable; NA = Not Available; W = Withheld to avoid disclosure of individual company data. |
| Release Date: 4/30/2024 |
| Next Release Date: 8/30/2024 |