|
Download Data (XLS File) |
|
||||||||
|
||||||||
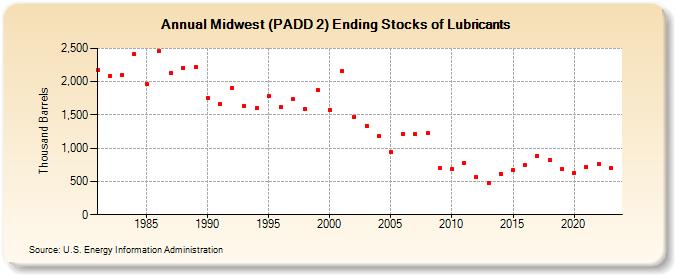
| Midwest (PADD 2) Ending Stocks of Lubricants (Thousand Barrels) | ||||||||
| Decade | Year-0 | Year-1 | Year-2 | Year-3 | Year-4 | Year-5 | Year-6 | Year-7 | Year-8 | Year-9 |
|---|---|---|---|---|---|---|---|---|---|---|
| 1980's | 2,177 | 2,088 | 2,106 | 2,419 | 1,962 | 2,455 | 2,125 | 2,208 | 2,221 | |
| 1990's | 1,758 | 1,664 | 1,906 | 1,636 | 1,598 | 1,781 | 1,615 | 1,735 | 1,585 | 1,881 |
| 2000's | 1,576 | 2,159 | 1,471 | 1,338 | 1,177 | 940 | 1,210 | 1,212 | 1,228 | 697 |
| 2010's | 687 | 779 | 570 | 478 | 619 | 669 | 740 | 883 | 827 | 690 |
| 2020's | 633 | 721 | 760 | 697 |
| - = No Data Reported; -- = Not Applicable; NA = Not Available; W = Withheld to avoid disclosure of individual company data. |
| Release Date: 3/29/2024 |
| Next Release Date: 8/30/2024 |