|
Download Data (XLS File) |
|
||||||||
|
||||||||
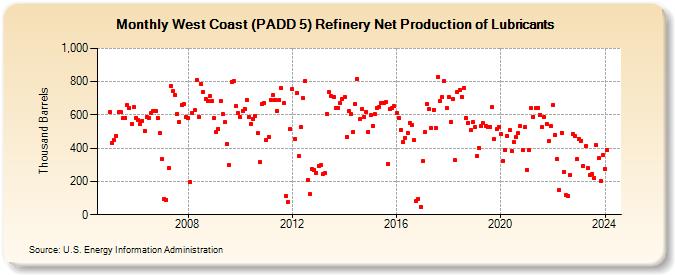
| West Coast (PADD 5) Refinery Net Production of Lubricants (Thousand Barrels) | ||||||||
| Year | Jan | Feb | Mar | Apr | May | Jun | Jul | Aug | Sep | Oct | Nov | Dec |
|---|---|---|---|---|---|---|---|---|---|---|---|---|
| 2005 | 617 | 433 | 448 | 476 | 615 | 615 | 579 | 582 | 657 | 639 | 547 | 647 |
| 2006 | 583 | 569 | 543 | 566 | 502 | 587 | 583 | 609 | 626 | 625 | 579 | 491 |
| 2007 | 337 | 96 | 90 | 281 | 775 | 743 | 721 | 607 | 560 | 659 | 664 | 587 |
| 2008 | 583 | 195 | 614 | 627 | 810 | 586 | 786 | 739 | 698 | 686 | 711 | 684 |
| 2009 | 580 | 497 | 517 | 682 | 603 | 555 | 424 | 297 | 798 | 802 | 652 | 613 |
| 2010 | 587 | 626 | 638 | 691 | 587 | 547 | 577 | 595 | 489 | 314 | 667 | 670 |
| 2011 | 452 | 469 | 692 | 717 | 692 | 624 | 689 | 761 | 670 | 114 | 77 | 515 |
| 2012 | 753 | 457 | 732 | 352 | 525 | 701 | 805 | 209 | 123 | 274 | 271 | 251 |
| 2013 | 294 | 296 | 243 | 249 | 606 | 736 | 711 | 710 | 644 | 641 | 673 | 697 |
| 2014 | 709 | 468 | 622 | 607 | 497 | 666 | 816 | 574 | 636 | 589 | 620 | 499 |
| 2015 | 597 | 533 | 603 | 643 | 648 | 672 | 672 | 676 | 306 | 635 | 644 | 652 |
| 2016 | 612 | 583 | 512 | 436 | 464 | 493 | 552 | 538 | 448 | 82 | 97 | 49 |
| 2017 | 321 | 495 | 664 | 635 | 521 | 632 | 523 | 828 | 686 | 706 | 801 | 641 |
| 2018 | 708 | 560 | 697 | 327 | 740 | 752 | 710 | 763 | 582 | 554 | 507 | 556 |
| 2019 | 526 | 352 | 400 | 533 | 549 | 534 | 526 | 529 | 645 | 455 | 513 | 527 |
| 2020 | 483 | 323 | 392 | 476 | 507 | 381 | 435 | 465 | 489 | 534 | 391 | 525 |
| 2021 | 270 | 387 | 639 | 589 | 639 | 644 | 602 | 527 | 586 | 544 | 441 | 531 |
| 2022 | 660 | 479 | 333 | 150 | 494 | 259 | 117 | 112 | 240 | 487 | 473 | 332 |
| 2023 | 458 | 445 | 294 | 411 | 282 | 236 | 244 | 223 | 419 | 339 | 202 | 360 |
| 2024 | 274 | |||||||||||
| - = No Data Reported; -- = Not Applicable; NA = Not Available; W = Withheld to avoid disclosure of individual company data. |
| Release Date: 3/29/2024 |
| Next Release Date: 4/30/2024 |
Referring Pages: