|
Download Data (XLS File) |
|
||||||||
|
||||||||
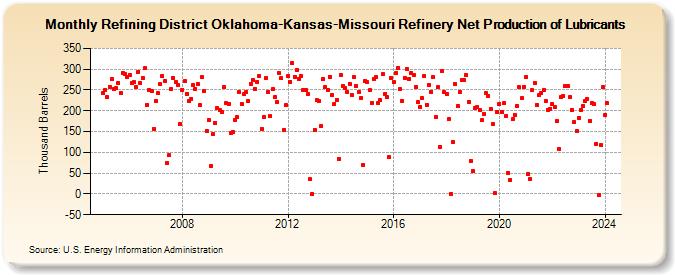
| Refining District Oklahoma-Kansas-Missouri Refinery Net Production of Lubricants (Thousand Barrels) | ||||||||
| Year | Jan | Feb | Mar | Apr | May | Jun | Jul | Aug | Sep | Oct | Nov | Dec |
|---|---|---|---|---|---|---|---|---|---|---|---|---|
| 2005 | 243 | 251 | 233 | 258 | 276 | 252 | 254 | 267 | 243 | 292 | 288 | 281 |
| 2006 | 287 | 267 | 269 | 258 | 294 | 266 | 279 | 302 | 215 | 251 | 248 | 157 |
| 2007 | 224 | 242 | 264 | 283 | 271 | 75 | 93 | 252 | 279 | 270 | 262 | 168 |
| 2008 | 251 | 271 | 241 | 224 | 229 | 262 | 253 | 264 | 213 | 280 | 248 | 151 |
| 2009 | 178 | 66 | 143 | 171 | 206 | 201 | 196 | 257 | 218 | 217 | 146 | 149 |
| 2010 | 177 | 184 | 244 | 217 | 240 | 244 | 224 | 264 | 275 | 253 | 270 | 284 |
| 2011 | 157 | 184 | 279 | 245 | 187 | 252 | 232 | 221 | 291 | 278 | 154 | 213 |
| 2012 | 283 | 270 | 314 | 282 | 297 | 277 | 284 | 250 | 250 | 241 | 35 | -1 |
| 2013 | 154 | 225 | 223 | 163 | 276 | 256 | 249 | 282 | 237 | 217 | 226 | 84 |
| 2014 | 287 | 260 | 254 | 244 | 265 | 239 | 281 | 260 | 244 | 231 | 70 | 272 |
| 2015 | 268 | 249 | 219 | 277 | 281 | 219 | 225 | 288 | 241 | 232 | 89 | 279 |
| 2016 | 269 | 290 | 304 | 252 | 224 | 279 | 301 | 277 | 292 | 287 | 257 | 220 |
| 2017 | 210 | 230 | 284 | 215 | 263 | 246 | 280 | 185 | 256 | 114 | 296 | 244 |
| 2018 | 241 | 180 | 0 | 124 | 264 | 212 | 244 | 274 | 273 | 286 | 221 | 80 |
| 2019 | 55 | 206 | 208 | 201 | 177 | 193 | 242 | 235 | 205 | 167 | 2 | 198 |
| 2020 | 217 | 198 | 218 | 187 | 51 | 34 | 179 | 191 | 211 | 256 | 230 | 258 |
| 2021 | 281 | 47 | 37 | 249 | 267 | 215 | 237 | 242 | 250 | 223 | 203 | 205 |
| 2022 | 217 | 208 | 175 | 107 | 233 | 236 | 259 | 259 | 233 | 203 | 173 | 151 |
| 2023 | 182 | 203 | 212 | 223 | 228 | 176 | 219 | 216 | 121 | -3 | 118 | 256 |
| 2024 | 190 | |||||||||||
| - = No Data Reported; -- = Not Applicable; NA = Not Available; W = Withheld to avoid disclosure of individual company data. |
| Release Date: 3/29/2024 |
| Next Release Date: 4/30/2024 |