|
Download Data (XLS File) |
|
||||||||
|
||||||||
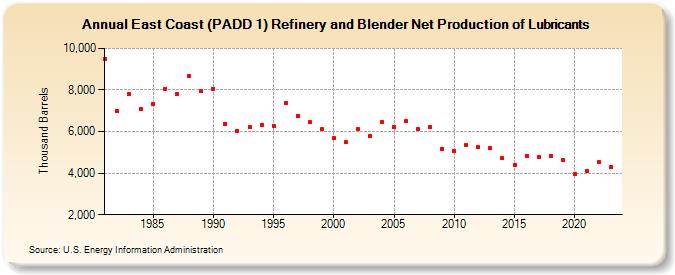
| East Coast (PADD 1) Refinery and Blender Net Production of Lubricants (Thousand Barrels) | ||||||||
| Decade | Year-0 | Year-1 | Year-2 | Year-3 | Year-4 | Year-5 | Year-6 | Year-7 | Year-8 | Year-9 |
|---|---|---|---|---|---|---|---|---|---|---|
| 1980's | 9,489 | 6,992 | 7,809 | 7,094 | 7,343 | 8,036 | 7,828 | 8,662 | 7,954 | |
| 1990's | 8,049 | 6,380 | 6,040 | 6,234 | 6,317 | 6,279 | 7,374 | 6,765 | 6,440 | 6,104 |
| 2000's | 5,668 | 5,477 | 6,112 | 5,807 | 6,452 | 6,215 | 6,491 | 6,108 | 6,211 | 5,175 |
| 2010's | 5,075 | 5,356 | 5,238 | 5,200 | 4,713 | 4,380 | 4,810 | 4,756 | 4,847 | 4,651 |
| 2020's | 3,957 | 4,117 | 4,512 | 4,273 |
| - = No Data Reported; -- = Not Applicable; NA = Not Available; W = Withheld to avoid disclosure of individual company data. |
| Release Date: 3/29/2024 |
| Next Release Date: 8/30/2024 |