|
Download Data (XLS File) |
|
||||||||
|
||||||||
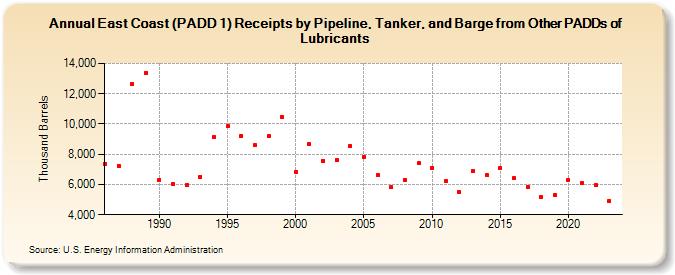
| East Coast (PADD 1) Receipts by Pipeline, Tanker, and Barge from Other PADDs of Lubricants (Thousand Barrels) | ||||||||
| Decade | Year-0 | Year-1 | Year-2 | Year-3 | Year-4 | Year-5 | Year-6 | Year-7 | Year-8 | Year-9 |
|---|---|---|---|---|---|---|---|---|---|---|
| 1980's | 7,375 | 7,245 | 12,657 | 13,388 | ||||||
| 1990's | 6,309 | 6,043 | 5,957 | 6,522 | 9,145 | 9,846 | 9,213 | 8,585 | 9,173 | 10,474 |
| 2000's | 6,846 | 8,644 | 7,552 | 7,643 | 8,530 | 7,833 | 6,616 | 5,801 | 6,289 | 7,387 |
| 2010's | 7,106 | 6,197 | 5,476 | 6,895 | 6,609 | 7,076 | 6,406 | 5,846 | 5,167 | 5,319 |
| 2020's | 6,276 | 6,090 | 5,945 | 4,894 |
| - = No Data Reported; -- = Not Applicable; NA = Not Available; W = Withheld to avoid disclosure of individual company data. |
| Release Date: 3/29/2024 |
| Next Release Date: 8/30/2024 |