|
Download Data (XLS File) |
|
||||||||
|
||||||||
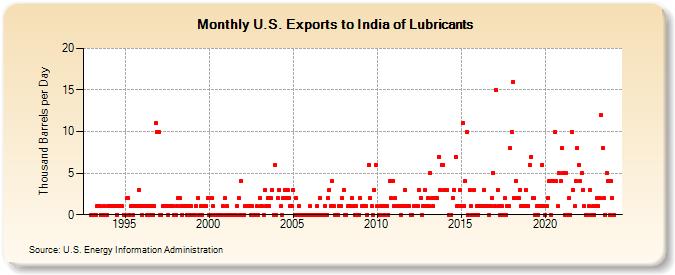
| U.S. Exports to India of Lubricants (Thousand Barrels per Day) | ||||||||
| Year | Jan | Feb | Mar | Apr | May | Jun | Jul | Aug | Sep | Oct | Nov | Dec |
|---|---|---|---|---|---|---|---|---|---|---|---|---|
| 1993 | 0 | 0 | 0 | 0 | 1 | 1 | 1 | 0 | 0 | 1 | 0 | 0 |
| 1994 | 1 | 1 | 1 | 1 | 1 | 1 | 0 | 1 | 1 | 1 | 1 | 0 |
| 1995 | 0 | 2 | 2 | 0 | 1 | 1 | 0 | 1 | 1 | 1 | 3 | 1 |
| 1996 | 0 | 1 | 1 | 1 | 0 | 1 | 0 | 1 | 0 | 1 | 11 | 10 |
| 1997 | 10 | 0 | 0 | 1 | 1 | 1 | 1 | 0 | 1 | 1 | 1 | 0 |
| 1998 | 0 | 1 | 2 | 2 | 1 | 0 | 1 | 1 | 0 | 1 | 0 | 1 |
| 1999 | 0 | 0 | 0 | 1 | 2 | 0 | 1 | 0 | 1 | 1 | 1 | 2 |
| 2000 | 0 | 0 | 2 | 1 | 0 | 0 | 0 | 0 | 0 | 0 | 1 | 2 |
| 2001 | 0 | 1 | 0 | 0 | 0 | 0 | 0 | 0 | 1 | 2 | 0 | 4 |
| 2002 | 0 | 0 | 1 | 1 | 1 | 1 | 0 | 1 | 0 | 0 | 1 | 0 |
| 2003 | 2 | 1 | 1 | 0 | 3 | 1 | 2 | 1 | 2 | 3 | 0 | 6 |
| 2004 | 0 | 2 | 3 | 1 | 0 | 2 | 3 | 2 | 3 | 2 | 1 | 1 |
| 2005 | 3 | 0 | 2 | 0 | 1 | 0 | 0 | 0 | 0 | 0 | 0 | 0 |
| 2006 | 1 | 0 | 0 | 0 | 0 | 1 | 0 | 2 | 0 | 0 | 0 | 1 |
| 2007 | 0 | 2 | 3 | 1 | 4 | 1 | 0 | 0 | 0 | 1 | 1 | 2 |
| 2008 | 3 | 0 | 0 | 1 | 1 | 1 | 2 | 1 | 0 | 1 | 0 | 0 |
| 2009 | 2 | 1 | 1 | 1 | 1 | 0 | 6 | 2 | 1 | 0 | 3 | 6 |
| 2010 | 1 | 0 | 0 | 1 | 1 | 0 | 1 | 1 | 0 | 4 | 2 | 4 |
| 2011 | 1 | 2 | 1 | 1 | 1 | 0 | 1 | 1 | 3 | 1 | 1 | 1 |
| 2012 | 0 | 0 | 1 | 1 | 1 | 1 | 3 | 2 | 0 | 1 | 3 | 1 |
| 2013 | 2 | 1 | 5 | 2 | 1 | 2 | 2 | 2 | 7 | 3 | 6 | 6 |
| 2014 | 3 | 3 | 3 | 0 | 0 | 0 | 2 | 3 | 7 | 1 | 1 | 3 |
| 2015 | 1 | 11 | 1 | 4 | 10 | 0 | 3 | 1 | 0 | 3 | 0 | 1 |
| 2016 | 0 | 1 | 1 | 1 | 3 | 1 | 1 | 1 | 0 | 1 | 2 | 5 |
| 2017 | 1 | 15 | 3 | 1 | 0 | 1 | 0 | 2 | 0 | 1 | 1 | 8 |
| 2018 | 10 | 16 | 2 | 4 | 2 | 2 | 3 | 1 | 1 | 1 | 3 | 1 |
| 2019 | 1 | 6 | 7 | 2 | 2 | 0 | 1 | 0 | 1 | 1 | 6 | 1 |
| 2020 | 0 | 1 | 2 | 4 | 0 | 4 | 4 | 10 | 4 | 1 | 5 | 4 |
| 2021 | 8 | 5 | 0 | 5 | 0 | 2 | 0 | 10 | 3 | 1 | 4 | 8 |
| 2022 | 6 | 4 | 5 | 3 | 1 | 0 | 0 | 1 | 3 | 0 | 1 | 0 |
| 2023 | 1 | 2 | 1 | 2 | 12 | 8 | 2 | 0 | 5 | 4 | 0 | 4 |
| 2024 | 2 | |||||||||||
| - = No Data Reported; -- = Not Applicable; NA = Not Available; W = Withheld to avoid disclosure of individual company data. |
| Release Date: 3/29/2024 |
| Next Release Date: 4/30/2024 |