|
Download Data (XLS File) |
|
||||||||
|
||||||||
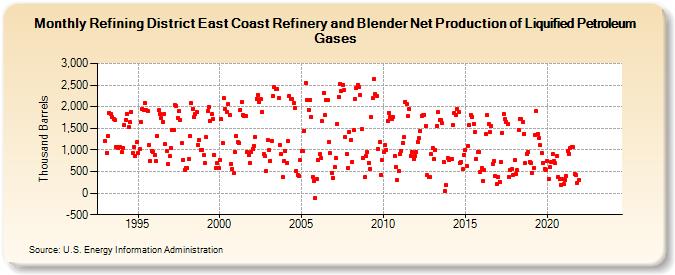
| Refining District East Coast Refinery and Blender Net Production of Liquified Petroleum Gases (Thousand Barrels) | ||||||||
| Year | Jan | Feb | Mar | Apr | May | Jun | Jul | Aug | Sep | Oct | Nov | Dec |
|---|---|---|---|---|---|---|---|---|---|---|---|---|
| 1993 | 1,196 | 935 | 1,319 | 1,859 | 1,842 | 1,764 | 1,726 | 1,694 | 1,064 | 1,051 | 1,060 | 1,069 |
| 1994 | 943 | 1,040 | 1,580 | 1,700 | 1,836 | 1,528 | 1,636 | 1,881 | 917 | 1,072 | 848 | 1,172 |
| 1995 | 938 | 1,011 | 1,637 | 1,957 | 1,926 | 2,086 | 1,919 | 1,892 | 1,118 | 739 | 967 | 960 |
| 1996 | 873 | 746 | 1,315 | 1,914 | 1,826 | 1,729 | 1,651 | 1,836 | 1,125 | 968 | 668 | 858 |
| 1997 | 1,045 | 1,466 | 1,458 | 2,044 | 2,023 | 1,744 | 1,894 | 1,700 | 1,150 | 777 | 540 | 592 |
| 1998 | 576 | 780 | 1,318 | 2,082 | 1,953 | 1,751 | 1,834 | 1,881 | 1,120 | 1,225 | 998 | 1,006 |
| 1999 | 874 | 707 | 1,293 | 1,903 | 2,003 | 1,664 | 1,823 | 1,718 | 886 | 573 | 701 | 572 |
| 2000 | 767 | 1,706 | 1,154 | 2,192 | 1,944 | 1,888 | 2,060 | 1,807 | 672 | 565 | 455 | 956 |
| 2001 | 1,317 | 1,172 | 1,171 | 1,933 | 2,109 | 1,808 | 1,775 | 1,784 | 943 | 873 | 700 | 962 |
| 2002 | 1,030 | 1,099 | 1,302 | 2,189 | 2,271 | 2,102 | 2,180 | 1,885 | 902 | 848 | 504 | 1,223 |
| 2003 | 998 | 754 | 1,208 | 2,250 | 2,451 | 2,416 | 2,417 | 2,200 | 1,109 | 900 | 367 | 737 |
| 2004 | 980 | 707 | 1,201 | 2,252 | 2,171 | 2,177 | 2,082 | 1,974 | 516 | 426 | 402 | 767 |
| 2005 | 963 | 984 | 1,446 | 2,550 | 2,148 | 1,924 | 2,160 | 1,760 | 382 | 287 | -110 | 331 |
| 2006 | 771 | 898 | 803 | 1,662 | 2,325 | 1,801 | 2,152 | 2,148 | 1,192 | 919 | 476 | 361 |
| 2007 | 604 | 811 | 1,602 | 2,231 | 2,535 | 2,374 | 2,509 | 2,389 | 1,292 | 907 | 590 | 1,421 |
| 2008 | 1,236 | 727 | 1,456 | 2,182 | 2,425 | 2,507 | 2,459 | 2,266 | 1,477 | 816 | 362 | 849 |
| 2009 | 941 | 705 | 565 | 1,754 | 2,190 | 2,636 | 2,298 | 2,257 | 1,021 | 1,183 | 427 | 772 |
| 2010 | 961 | 1,120 | 1,003 | 1,664 | 1,854 | 1,757 | 1,708 | 1,761 | 862 | 600 | 306 | 509 |
| 2011 | 912 | 985 | 1,170 | 1,292 | 2,120 | 2,055 | 1,775 | 1,950 | 869 | 962 | 784 | 866 |
| 2012 | 952 | 1,187 | 1,265 | 1,439 | 1,790 | 1,798 | 1,818 | 1,554 | 411 | 383 | 380 | 894 |
| 2013 | 1,051 | 788 | 1,002 | 1,552 | 1,877 | 1,703 | 1,694 | 1,615 | 719 | 47 | 186 | 814 |
| 2014 | 772 | 799 | 792 | 1,582 | 1,858 | 1,807 | 1,941 | 1,883 | 694 | 723 | 552 | 886 |
| 2015 | 995 | 625 | 1,093 | 1,571 | 1,809 | 1,768 | 1,601 | 1,422 | 788 | 956 | 952 | 489 |
| 2016 | 585 | 284 | 530 | 1,367 | 1,800 | 1,589 | 1,412 | 1,553 | 684 | 744 | 391 | 213 |
| 2017 | 378 | 264 | 716 | 1,397 | 1,837 | 1,705 | 1,646 | 1,589 | 376 | 528 | 553 | 428 |
| 2018 | 761 | 443 | 529 | 1,471 | 1,726 | 1,716 | 1,657 | 1,377 | 696 | 911 | 953 | 726 |
| 2019 | 701 | 468 | 583 | 1,336 | 1,892 | 1,375 | 1,267 | 1,104 | 929 | 703 | 560 | 537 |
| 2020 | 739 | 331 | 596 | 716 | 898 | 754 | 686 | 849 | 377 | 333 | 190 | 325 |
| 2021 | 204 | 305 | 394 | 972 | 908 | 1,052 | 1,073 | 1,067 | 438 | 419 | 238 | 308 |
| 2022 | -- | -- | -- | -- | -- | -- | -- | -- | -- | -- | -- | -- |
| 2023 | -- | -- | -- | -- | -- | -- | -- | -- | -- | -- | -- | -- |
| 2024 | -- | |||||||||||
| - = No Data Reported; -- = Not Applicable; NA = Not Available; W = Withheld to avoid disclosure of individual company data. |
| Release Date: 3/29/2024 |
| Next Release Date: 4/30/2024 |