|
Download Data (XLS File) |
|
||||||||
|
||||||||
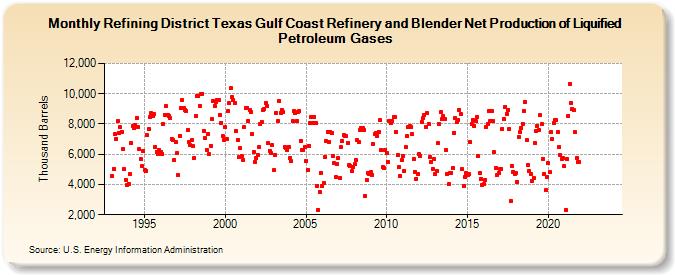
| Refining District Texas Gulf Coast Refinery and Blender Net Production of Liquified Petroleum Gases (Thousand Barrels) | ||||||||
| Year | Jan | Feb | Mar | Apr | May | Jun | Jul | Aug | Sep | Oct | Nov | Dec |
|---|---|---|---|---|---|---|---|---|---|---|---|---|
| 1993 | 4,565 | 5,051 | 7,307 | 7,025 | 8,185 | 7,391 | 7,778 | 7,487 | 6,333 | 5,010 | 4,326 | 3,960 |
| 1994 | 4,063 | 4,680 | 6,739 | 7,881 | 7,766 | 7,935 | 8,408 | 7,782 | 6,323 | 5,686 | 5,214 | 6,211 |
| 1995 | 4,967 | 4,921 | 7,241 | 7,637 | 8,457 | 8,694 | 8,499 | 8,654 | 6,483 | 6,161 | 6,031 | 6,258 |
| 1996 | 6,173 | 6,035 | 8,031 | 8,598 | 9,164 | 8,604 | 8,538 | 8,367 | 7,037 | 6,918 | 5,616 | 6,780 |
| 1997 | 6,078 | 4,630 | 7,226 | 9,034 | 9,556 | 9,066 | 8,946 | 8,854 | 7,611 | 6,813 | 6,577 | 6,953 |
| 1998 | 6,512 | 5,782 | 8,552 | 9,851 | 9,824 | 9,219 | 9,991 | 10,001 | 7,556 | 7,043 | 6,300 | 7,370 |
| 1999 | 5,993 | 6,571 | 8,297 | 9,522 | 9,183 | 9,422 | 9,602 | 9,617 | 8,625 | 8,097 | 7,194 | 6,956 |
| 2000 | 7,781 | 6,999 | 8,844 | 9,368 | 10,347 | 9,754 | 9,567 | 9,388 | 7,544 | 6,948 | 5,786 | 6,389 |
| 2001 | 5,863 | 5,644 | 7,769 | 9,031 | 9,051 | 8,199 | 8,932 | 8,811 | 7,338 | 6,156 | 5,487 | 5,759 |
| 2002 | 5,963 | 6,505 | 7,994 | 8,145 | 8,938 | 9,002 | 9,395 | 9,175 | 6,738 | 6,237 | 6,080 | 6,597 |
| 2003 | 4,929 | 5,972 | 8,747 | 8,211 | 9,507 | 8,752 | 8,925 | 8,793 | 6,454 | 6,397 | 6,257 | 6,481 |
| 2004 | 5,757 | 5,539 | 8,209 | 8,851 | 8,702 | 8,179 | 8,823 | 8,855 | 6,895 | 6,290 | 6,284 | 6,492 |
| 2005 | 5,568 | 4,950 | 6,567 | 8,049 | 8,472 | 8,090 | 8,492 | 8,081 | 3,899 | 2,334 | 3,533 | 4,789 |
| 2006 | 3,910 | 4,109 | 5,819 | 6,884 | 7,500 | 6,833 | 7,474 | 7,385 | 5,862 | 5,401 | 4,472 | 5,348 |
| 2007 | 5,752 | 4,427 | 6,451 | 6,848 | 7,249 | 7,189 | 7,196 | 6,761 | 5,319 | 5,247 | 4,902 | 5,124 |
| 2008 | 5,352 | 5,631 | 6,908 | 6,823 | 7,615 | 7,759 | 7,735 | 7,604 | 3,262 | 4,284 | 4,767 | 4,678 |
| 2009 | 4,799 | 4,620 | 6,677 | 7,319 | 7,400 | 7,219 | 7,500 | 8,232 | 6,270 | 5,144 | 5,067 | 6,265 |
| 2010 | 6,048 | 5,470 | 8,188 | 8,034 | 8,198 | 8,436 | 8,480 | 7,490 | 5,953 | 5,147 | 4,551 | 5,592 |
| 2011 | 5,882 | 4,912 | 6,460 | 7,179 | 7,807 | 7,862 | 7,821 | 7,332 | 5,663 | 4,834 | 4,390 | 4,706 |
| 2012 | 5,992 | 5,854 | 8,118 | 8,403 | 8,561 | 7,796 | 8,711 | 7,993 | 5,809 | 5,507 | 5,037 | 5,681 |
| 2013 | 4,704 | 4,885 | 6,719 | 8,004 | 8,773 | 8,328 | 8,543 | 8,338 | 6,277 | 4,683 | 4,013 | 4,781 |
| 2014 | 4,788 | 5,079 | 7,423 | 8,401 | 8,127 | 8,250 | 8,911 | 8,629 | 5,010 | 3,873 | 4,513 | 4,760 |
| 2015 | 4,642 | 4,664 | 6,813 | 8,002 | 8,268 | 7,884 | 8,199 | 8,452 | 5,888 | 4,778 | 4,350 | 3,968 |
| 2016 | 4,014 | 4,323 | 7,808 | 8,001 | 8,868 | 8,197 | 8,841 | 8,193 | 6,123 | 5,057 | 4,597 | 4,760 |
| 2017 | 5,012 | 5,047 | 7,693 | 8,306 | 9,124 | 8,649 | 8,933 | 7,662 | 2,894 | 5,232 | 4,842 | 4,699 |
| 2018 | 4,735 | 4,185 | 7,163 | 7,444 | 7,739 | 8,018 | 8,839 | 9,479 | 6,955 | 5,314 | 4,866 | 4,702 |
| 2019 | 4,241 | 4,430 | 6,754 | 7,547 | 7,888 | 7,609 | 8,573 | 7,981 | 5,706 | 4,684 | 3,603 | 4,507 |
| 2020 | 5,390 | 4,799 | 7,455 | 6,990 | 8,067 | 8,256 | 8,249 | 7,446 | 6,470 | 5,931 | 5,706 | 5,761 |
| 2021 | 5,201 | 2,326 | 5,668 | 8,554 | 10,651 | 9,373 | 8,980 | 8,917 | 7,445 | 5,758 | 5,476 | 5,481 |
| 2022 | -- | -- | -- | -- | -- | -- | -- | -- | -- | -- | -- | -- |
| 2023 | -- | -- | -- | -- | -- | -- | -- | -- | -- | -- | -- | -- |
| 2024 | -- | |||||||||||
| - = No Data Reported; -- = Not Applicable; NA = Not Available; W = Withheld to avoid disclosure of individual company data. |
| Release Date: 3/29/2024 |
| Next Release Date: 4/30/2024 |