|
Download Data (XLS File) |
|
||||||||
|
||||||||
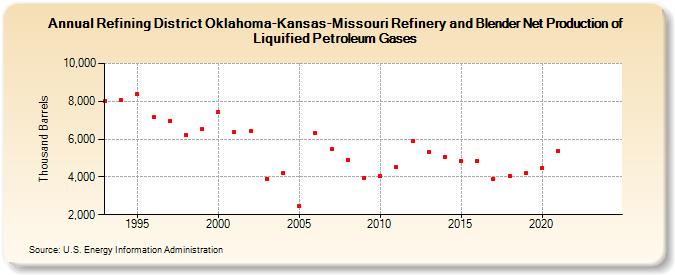
| Refining District Oklahoma-Kansas-Missouri Refinery and Blender Net Production of Liquified Petroleum Gases (Thousand Barrels) | ||||||||
| Decade | Year-0 | Year-1 | Year-2 | Year-3 | Year-4 | Year-5 | Year-6 | Year-7 | Year-8 | Year-9 |
|---|---|---|---|---|---|---|---|---|---|---|
| 1990's | 7,989 | 8,049 | 8,367 | 7,150 | 6,983 | 6,222 | 6,540 | |||
| 2000's | 7,410 | 6,354 | 6,436 | 3,913 | 4,181 | 2,446 | 6,309 | 5,451 | 4,908 | 3,941 |
| 2010's | 4,044 | 4,507 | 5,889 | 5,316 | 5,076 | 4,842 | 4,844 | 3,904 | 4,053 | 4,184 |
| 2020's | 4,471 | 5,383 | -- | -- |
| - = No Data Reported; -- = Not Applicable; NA = Not Available; W = Withheld to avoid disclosure of individual company data. |
| Release Date: 3/29/2024 |
| Next Release Date: 8/30/2024 |