|
Download Data (XLS File) |
|
||||||||
|
||||||||
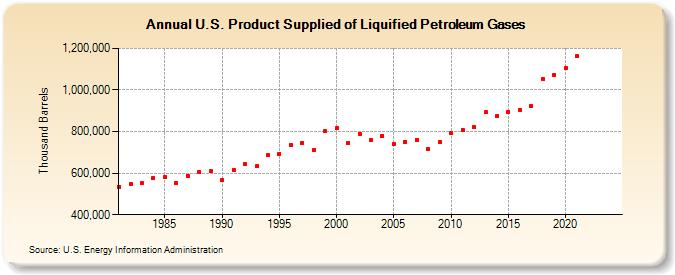
| U.S. Product Supplied of Liquified Petroleum Gases (Thousand Barrels) | ||||||||
| Decade | Year-0 | Year-1 | Year-2 | Year-3 | Year-4 | Year-5 | Year-6 | Year-7 | Year-8 | Year-9 |
|---|---|---|---|---|---|---|---|---|---|---|
| 1980's | 534,971 | 547,285 | 550,684 | 575,505 | 583,601 | 552,055 | 588,283 | 606,069 | 608,923 | |
| 1990's | 567,968 | 616,335 | 642,433 | 632,916 | 686,090 | 693,275 | 736,342 | 743,804 | 712,514 | 801,176 |
| 2000's | 816,485 | 746,174 | 789,338 | 757,050 | 780,487 | 740,832 | 749,126 | 761,009 | 715,119 | 748,729 |
| 2010's | 792,221 | 809,510 | 821,009 | 892,412 | 872,498 | 895,934 | 905,665 | 925,138 | 1,051,552 | 1,073,572 |
| 2020's | 1,104,945 | 1,161,657 | -- | -- |
| - = No Data Reported; -- = Not Applicable; NA = Not Available; W = Withheld to avoid disclosure of individual company data. |
| Release Date: 3/29/2024 |
| Next Release Date: 8/30/2024 |