|
Download Data (XLS File) |
|
||||||||
|
||||||||
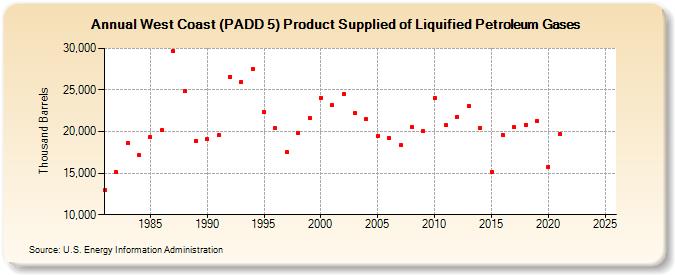
| West Coast (PADD 5) Product Supplied of Liquified Petroleum Gases (Thousand Barrels) | ||||||||
| Decade | Year-0 | Year-1 | Year-2 | Year-3 | Year-4 | Year-5 | Year-6 | Year-7 | Year-8 | Year-9 |
|---|---|---|---|---|---|---|---|---|---|---|
| 1980's | 12,930 | 15,105 | 18,621 | 17,157 | 19,372 | 20,149 | 29,669 | 24,850 | 18,895 | |
| 1990's | 19,059 | 19,527 | 26,613 | 25,943 | 27,549 | 22,354 | 20,421 | 17,491 | 19,845 | 21,636 |
| 2000's | 24,091 | 23,173 | 24,542 | 22,177 | 21,466 | 19,456 | 19,180 | 18,350 | 20,503 | 20,043 |
| 2010's | 24,083 | 20,757 | 21,775 | 23,048 | 20,467 | 15,149 | 19,572 | 20,535 | 20,844 | 21,321 |
| 2020's | 15,777 | 19,660 | -- | -- |
| - = No Data Reported; -- = Not Applicable; NA = Not Available; W = Withheld to avoid disclosure of individual company data. |
| Release Date: 8/30/2024 |
| Next Release Date: 8/29/2025 |