|
Download Data (XLS File) |
|
||||||||
|
||||||||
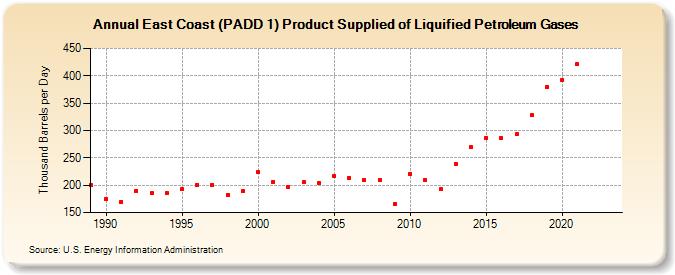
| East Coast (PADD 1) Product Supplied of Liquified Petroleum Gases (Thousand Barrels per Day) | ||||||||
| Decade | Year-0 | Year-1 | Year-2 | Year-3 | Year-4 | Year-5 | Year-6 | Year-7 | Year-8 | Year-9 |
|---|---|---|---|---|---|---|---|---|---|---|
| 1980's | 200 | |||||||||
| 1990's | 175 | 170 | 190 | 185 | 185 | 193 | 201 | 201 | 183 | 189 |
| 2000's | 224 | 206 | 197 | 205 | 204 | 217 | 214 | 209 | 210 | 166 |
| 2010's | 221 | 209 | 193 | 239 | 269 | 287 | 286 | 293 | 328 | 380 |
| 2020's | 393 | 421 | -- | -- |
| - = No Data Reported; -- = Not Applicable; NA = Not Available; W = Withheld to avoid disclosure of individual company data. |
| Release Date: 3/29/2024 |
| Next Release Date: 8/30/2024 |