|
Download Data (XLS File) |
|
||||||||
|
||||||||
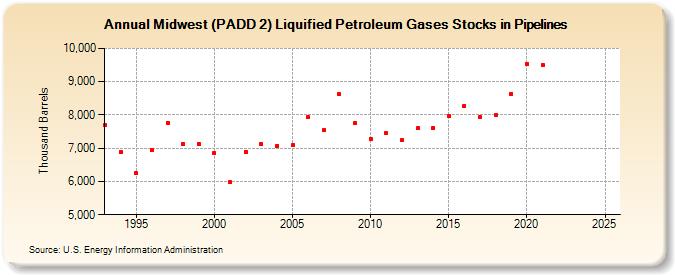
| Midwest (PADD 2) Liquified Petroleum Gases Stocks in Pipelines (Thousand Barrels) | ||||||||
| Decade | Year-0 | Year-1 | Year-2 | Year-3 | Year-4 | Year-5 | Year-6 | Year-7 | Year-8 | Year-9 |
|---|---|---|---|---|---|---|---|---|---|---|
| 1990's | 7,682 | 6,891 | 6,249 | 6,948 | 7,764 | 7,138 | 7,126 | |||
| 2000's | 6,852 | 5,971 | 6,894 | 7,127 | 7,073 | 7,085 | 7,931 | 7,533 | 8,618 | 7,758 |
| 2010's | 7,273 | 7,446 | 7,232 | 7,597 | 7,609 | 7,974 | 8,271 | 7,936 | 7,987 | 8,633 |
| 2020's | 9,544 | 9,508 | -- | -- |
| - = No Data Reported; -- = Not Applicable; NA = Not Available; W = Withheld to avoid disclosure of individual company data. |
| Release Date: 3/29/2024 |
| Next Release Date: 8/30/2024 |