|
Download Data (XLS File) |
|
||||||||
|
||||||||
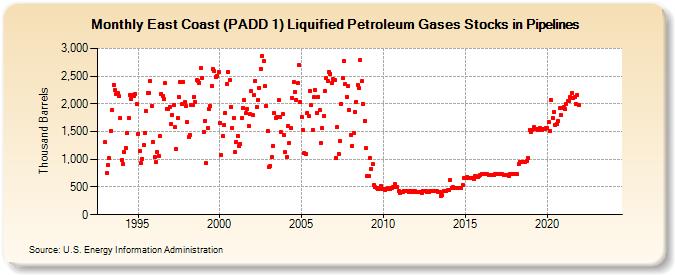
| East Coast (PADD 1) Liquified Petroleum Gases Stocks in Pipelines (Thousand Barrels) | ||||||||
| Year | Jan | Feb | Mar | Apr | May | Jun | Jul | Aug | Sep | Oct | Nov | Dec |
|---|---|---|---|---|---|---|---|---|---|---|---|---|
| 1993 | 1,306 | 752 | 888 | 1,015 | 1,516 | 1,887 | 2,340 | 2,246 | 2,177 | 2,193 | 2,135 | 1,741 |
| 1994 | 988 | 910 | 1,128 | 1,201 | 1,471 | 1,744 | 2,158 | 2,092 | 2,155 | 2,137 | 2,182 | 1,999 |
| 1995 | 1,461 | 1,148 | 926 | 1,011 | 1,251 | 1,476 | 1,868 | 2,202 | 2,193 | 2,410 | 1,968 | 1,311 |
| 1996 | 1,035 | 946 | 1,137 | 1,054 | 1,415 | 2,185 | 2,145 | 2,085 | 2,371 | 1,908 | 1,903 | 1,941 |
| 1997 | 1,644 | 1,807 | 1,979 | 1,574 | 1,191 | 1,740 | 2,126 | 2,397 | 1,991 | 2,394 | 2,027 | 1,955 |
| 1998 | 1,667 | 1,407 | 1,446 | 1,974 | 1,983 | 2,128 | 2,037 | 2,422 | 2,415 | 2,384 | 2,645 | 2,474 |
| 1999 | 1,489 | 1,698 | 931 | 1,563 | 1,903 | 1,954 | 2,324 | 2,622 | 2,589 | 2,486 | 2,500 | 2,583 |
| 2000 | 1,653 | 1,081 | 1,422 | 1,619 | 1,838 | 2,359 | 2,575 | 2,435 | 1,951 | 1,564 | 1,747 | 1,128 |
| 2001 | 1,313 | 1,426 | 1,231 | 1,276 | 1,736 | 1,933 | 2,061 | 1,830 | 1,898 | 1,606 | 1,812 | 2,231 |
| 2002 | 1,793 | 2,154 | 2,416 | 1,949 | 2,076 | 2,286 | 2,635 | 2,860 | 2,775 | 2,315 | 1,965 | 1,509 |
| 2003 | 854 | 887 | 1,033 | 1,243 | 1,833 | 1,750 | 1,759 | 2,064 | 1,754 | 1,491 | 1,814 | 1,446 |
| 2004 | 1,123 | 1,043 | 1,604 | 1,297 | 1,558 | 2,114 | 2,397 | 2,221 | 2,075 | 2,367 | 2,696 | 2,030 |
| 2005 | 1,760 | 1,521 | 1,115 | 1,103 | 1,841 | 1,781 | 2,232 | 1,977 | 1,534 | 2,126 | 2,242 | 1,843 |
| 2006 | 2,127 | 1,884 | 1,296 | 1,568 | 1,785 | 2,230 | 2,457 | 2,412 | 2,579 | 2,545 | 2,367 | 2,441 |
| 2007 | 2,437 | 1,030 | 1,574 | 1,102 | 1,325 | 2,002 | 2,460 | 2,766 | 2,351 | 2,128 | 2,313 | 1,886 |
| 2008 | 1,440 | 1,247 | 1,471 | 1,860 | 2,041 | 2,346 | 2,283 | 2,788 | 2,404 | 2,000 | 1,695 | 1,195 |
| 2009 | 695 | 701 | 1,014 | 833 | 908 | 539 | 491 | 487 | 468 | 480 | 522 | 463 |
| 2010 | 456 | 452 | 463 | 477 | 471 | 472 | 479 | 496 | 552 | 501 | 503 | 422 |
| 2011 | 396 | 413 | 411 | 436 | 431 | 429 | 431 | 403 | 428 | 407 | 422 | 435 |
| 2012 | 412 | 412 | 410 | 410 | 387 | 431 | 430 | 428 | 415 | 418 | 420 | 423 |
| 2013 | 423 | 424 | 424 | 421 | 418 | 414 | 341 | 350 | 429 | 433 | 420 | 440 |
| 2014 | 443 | 621 | 490 | 491 | 487 | 485 | 482 | 482 | 486 | 485 | 540 | 666 |
| 2015 | 670 | 673 | 668 | 669 | 662 | 657 | 650 | 702 | 684 | 685 | 691 | 724 |
| 2016 | 730 | 735 | 731 | 728 | 726 | 723 | 714 | 715 | 719 | 724 | 727 | 732 |
| 2017 | 734 | 731 | 736 | 727 | 722 | 716 | 714 | 716 | 704 | 739 | 726 | 727 |
| 2018 | 726 | 728 | 728 | 911 | 956 | 959 | 957 | 956 | 959 | 971 | 1,029 | 1,532 |
| 2019 | 1,496 | 1,530 | 1,574 | 1,550 | 1,538 | 1,521 | 1,551 | 1,567 | 1,529 | 1,552 | 1,543 | 1,563 |
| 2020 | 1,564 | 1,664 | 1,513 | 2,063 | 1,753 | 1,861 | 1,616 | 1,645 | 1,694 | 1,920 | 1,795 | 1,931 |
| 2021 | 1,945 | 1,901 | 1,999 | 2,048 | 2,059 | 2,128 | 2,201 | 2,107 | 2,127 | 2,004 | 2,164 | 1,974 |
| 2022 | -- | -- | -- | -- | -- | -- | -- | -- | -- | -- | -- | -- |
| 2023 | -- | -- | -- | -- | -- | -- | -- | -- | -- | -- | -- | -- |
| 2024 | -- | |||||||||||
| - = No Data Reported; -- = Not Applicable; NA = Not Available; W = Withheld to avoid disclosure of individual company data. |
| Release Date: 3/29/2024 |
| Next Release Date: 4/30/2024 |