|
Download Data (XLS File) |
|
||||||||
|
||||||||
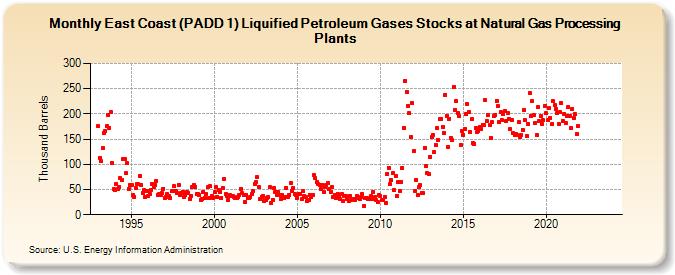
| East Coast (PADD 1) Liquified Petroleum Gases Stocks at Natural Gas Processing Plants (Thousand Barrels) | ||||||||
| Year | Jan | Feb | Mar | Apr | May | Jun | Jul | Aug | Sep | Oct | Nov | Dec |
|---|---|---|---|---|---|---|---|---|---|---|---|---|
| 1993 | 175 | 113 | 106 | 132 | 162 | 166 | 175 | 197 | 173 | 203 | 102 | 51 |
| 1994 | 50 | 61 | 52 | 55 | 72 | 69 | 111 | 111 | 82 | 102 | 52 | 59 |
| 1995 | 59 | 40 | 36 | 53 | 61 | 60 | 77 | 59 | 44 | 50 | 36 | 48 |
| 1996 | 37 | 42 | 50 | 61 | 54 | 59 | 67 | 40 | 42 | 39 | 44 | 52 |
| 1997 | 33 | 35 | 41 | 38 | 34 | 47 | 48 | 56 | 48 | 44 | 59 | 40 |
| 1998 | 43 | 46 | 36 | 39 | 46 | 44 | 31 | 38 | 54 | 59 | 55 | 42 |
| 1999 | 42 | 39 | 30 | 32 | 45 | 34 | 41 | 54 | 33 | 56 | 37 | 34 |
| 2000 | 45 | 54 | 36 | 49 | 46 | 34 | 53 | 71 | 41 | 38 | 30 | 39 |
| 2001 | 37 | 37 | 36 | 34 | 34 | 36 | 40 | 52 | 43 | 39 | 25 | 40 |
| 2002 | 34 | 33 | 36 | 41 | 47 | 61 | 65 | 74 | 54 | 32 | 36 | 38 |
| 2003 | 27 | 29 | 34 | 35 | 54 | 24 | 30 | 53 | 45 | 40 | 46 | 40 |
| 2004 | 31 | 39 | 34 | 35 | 53 | 36 | 40 | 62 | 47 | 53 | 42 | 40 |
| 2005 | 34 | 41 | 42 | 31 | 47 | 37 | 35 | 28 | 29 | 40 | 35 | 40 |
| 2006 | 78 | 72 | 64 | 60 | 59 | 52 | 59 | 46 | 55 | 58 | 63 | 51 |
| 2007 | 46 | 55 | 35 | 39 | 34 | 42 | 35 | 31 | 41 | 28 | 37 | 38 |
| 2008 | 31 | 27 | 37 | 30 | 31 | 31 | 30 | 37 | 33 | 32 | 36 | 41 |
| 2009 | 17 | 34 | 33 | 31 | 32 | 37 | 31 | 46 | 35 | 29 | 25 | 39 |
| 2010 | 37 | 29 | 29 | 35 | 24 | 81 | 93 | 60 | 68 | 82 | 49 | 76 |
| 2011 | 38 | 64 | 48 | 65 | 93 | 173 | 266 | 244 | 216 | 201 | 154 | 221 |
| 2012 | 126 | 48 | 69 | 39 | 55 | 58 | 43 | 43 | 133 | 96 | 82 | 80 |
| 2013 | 115 | 154 | 158 | 124 | 138 | 172 | 148 | 189 | 190 | 174 | 163 | 238 |
| 2014 | 196 | 135 | 190 | 153 | 148 | 254 | 208 | 225 | 201 | 195 | 139 | 167 |
| 2015 | 159 | 171 | 200 | 219 | 203 | 164 | 190 | 142 | 141 | 172 | 165 | 166 |
| 2016 | 174 | 171 | 178 | 177 | 227 | 185 | 197 | 177 | 153 | 183 | 196 | 198 |
| 2017 | 226 | 216 | 184 | 204 | 187 | 200 | 206 | 185 | 201 | 190 | 170 | 188 |
| 2018 | 163 | 159 | 161 | 158 | 183 | 155 | 158 | 169 | 208 | 187 | 156 | 180 |
| 2019 | 241 | 196 | 225 | 197 | 182 | 158 | 214 | 185 | 195 | 180 | 187 | 216 |
| 2020 | 201 | 187 | 211 | 192 | 179 | 225 | 217 | 210 | 202 | 179 | 203 | 222 |
| 2021 | 186 | 200 | 181 | 195 | 214 | 196 | 173 | 210 | 191 | 199 | 161 | 176 |
| 2022 | -- | -- | -- | -- | -- | -- | -- | -- | -- | -- | -- | -- |
| 2023 | -- | -- | -- | -- | -- | -- | -- | -- | -- | -- | -- | -- |
| 2024 | -- | |||||||||||
| - = No Data Reported; -- = Not Applicable; NA = Not Available; W = Withheld to avoid disclosure of individual company data. |
| Release Date: 3/29/2024 |
| Next Release Date: 4/30/2024 |