|
Download Data (XLS File) |
|
||||||||
|
||||||||
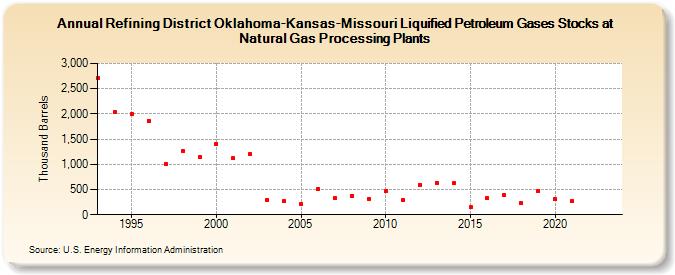
| Refining District Oklahoma-Kansas-Missouri Liquified Petroleum Gases Stocks at Natural Gas Processing Plants (Thousand Barrels) | ||||||||
| Decade | Year-0 | Year-1 | Year-2 | Year-3 | Year-4 | Year-5 | Year-6 | Year-7 | Year-8 | Year-9 |
|---|---|---|---|---|---|---|---|---|---|---|
| 1990's | 2,712 | 2,037 | 2,006 | 1,863 | 1,015 | 1,262 | 1,137 | |||
| 2000's | 1,403 | 1,119 | 1,201 | 293 | 266 | 208 | 509 | 328 | 374 | 321 |
| 2010's | 470 | 292 | 597 | 639 | 620 | 145 | 329 | 382 | 224 | 474 |
| 2020's | 302 | 268 | -- | -- |
| - = No Data Reported; -- = Not Applicable; NA = Not Available; W = Withheld to avoid disclosure of individual company data. |
| Release Date: 8/30/2024 |
| Next Release Date: 8/29/2025 |