|
Download Data (XLS File) |
|
||||||||
|
||||||||
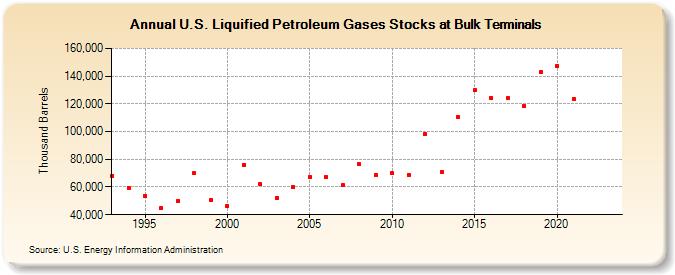
| U.S. Liquified Petroleum Gases Stocks at Bulk Terminals (Thousand Barrels) | ||||||||
| Decade | Year-0 | Year-1 | Year-2 | Year-3 | Year-4 | Year-5 | Year-6 | Year-7 | Year-8 | Year-9 |
|---|---|---|---|---|---|---|---|---|---|---|
| 1990's | 68,126 | 59,457 | 53,825 | 44,815 | 49,936 | 69,789 | 50,721 | |||
| 2000's | 46,131 | 76,133 | 61,884 | 52,130 | 59,817 | 67,363 | 67,323 | 61,274 | 76,308 | 68,524 |
| 2010's | 69,792 | 68,861 | 98,143 | 70,840 | 110,590 | 129,797 | 124,550 | 124,010 | 118,598 | 142,748 |
| 2020's | 147,585 | 123,672 | -- | -- |
| - = No Data Reported; -- = Not Applicable; NA = Not Available; W = Withheld to avoid disclosure of individual company data. |
| Release Date: 8/30/2024 |
| Next Release Date: 8/29/2025 |