|
Download Data (XLS File) |
|
||||||||
|
||||||||
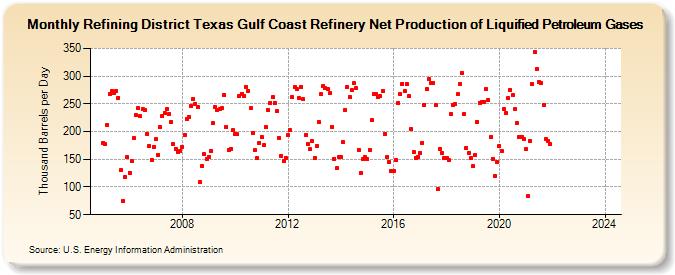
| Refining District Texas Gulf Coast Refinery Net Production of Liquified Petroleum Gases (Thousand Barrels per Day) | ||||||||
| Year | Jan | Feb | Mar | Apr | May | Jun | Jul | Aug | Sep | Oct | Nov | Dec |
|---|---|---|---|---|---|---|---|---|---|---|---|---|
| 2005 | 180 | 177 | 212 | 268 | 273 | 270 | 274 | 261 | 130 | 75 | 118 | 154 |
| 2006 | 126 | 147 | 188 | 229 | 242 | 228 | 241 | 238 | 195 | 174 | 149 | 173 |
| 2007 | 186 | 158 | 208 | 228 | 234 | 240 | 232 | 218 | 177 | 169 | 163 | 165 |
| 2008 | 173 | 194 | 223 | 227 | 246 | 259 | 250 | 245 | 109 | 138 | 159 | 151 |
| 2009 | 155 | 165 | 215 | 244 | 239 | 241 | 242 | 266 | 209 | 166 | 169 | 202 |
| 2010 | 195 | 195 | 264 | 268 | 264 | 281 | 274 | 242 | 198 | 166 | 152 | 180 |
| 2011 | 190 | 175 | 208 | 239 | 252 | 262 | 252 | 237 | 189 | 156 | 146 | 152 |
| 2012 | 193 | 202 | 262 | 280 | 276 | 260 | 281 | 258 | 194 | 178 | 168 | 183 |
| 2013 | 152 | 174 | 217 | 267 | 283 | 278 | 276 | 269 | 209 | 151 | 134 | 154 |
| 2014 | 154 | 181 | 239 | 280 | 262 | 275 | 287 | 278 | 167 | 125 | 150 | 154 |
| 2015 | 150 | 167 | 220 | 267 | 267 | 263 | 264 | 273 | 196 | 154 | 145 | 128 |
| 2016 | 129 | 149 | 252 | 267 | 286 | 273 | 285 | 264 | 204 | 163 | 153 | 154 |
| 2017 | 162 | 180 | 248 | 277 | 294 | 288 | 288 | 247 | 96 | 169 | 161 | 152 |
| 2018 | 153 | 149 | 231 | 248 | 250 | 267 | 285 | 306 | 232 | 171 | 162 | 152 |
| 2019 | 137 | 158 | 218 | 252 | 254 | 254 | 277 | 257 | 190 | 151 | 120 | 145 |
| 2020 | 174 | 165 | 240 | 233 | 260 | 275 | 266 | 240 | 216 | 191 | 190 | 186 |
| 2021 | 168 | 83 | 183 | 285 | 344 | 312 | 290 | 288 | 248 | 186 | 183 | 177 |
| 2022 | -- | -- | -- | -- | -- | -- | -- | -- | -- | -- | -- | -- |
| 2023 | -- | -- | -- | -- | -- | -- | -- | -- | -- | -- | -- | -- |
| 2024 | -- | |||||||||||
| - = No Data Reported; -- = Not Applicable; NA = Not Available; W = Withheld to avoid disclosure of individual company data. |
| Release Date: 3/29/2024 |
| Next Release Date: 4/30/2024 |