|
Download Data (XLS File) |
|
||||||||
|
||||||||
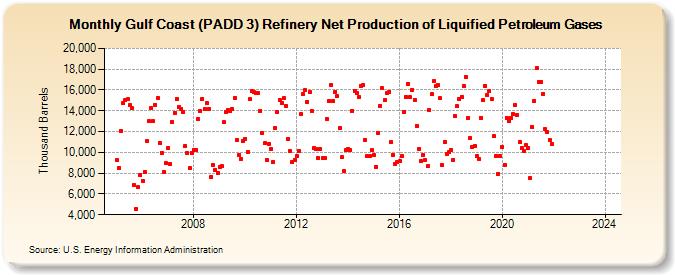
| Gulf Coast (PADD 3) Refinery Net Production of Liquified Petroleum Gases (Thousand Barrels) | ||||||||
| Year | Jan | Feb | Mar | Apr | May | Jun | Jul | Aug | Sep | Oct | Nov | Dec |
|---|---|---|---|---|---|---|---|---|---|---|---|---|
| 2005 | 9,259 | 8,528 | 12,092 | 14,710 | 15,030 | 15,107 | 14,548 | 14,229 | 6,852 | 4,581 | 6,623 | 7,785 |
| 2006 | 7,264 | 8,119 | 11,086 | 12,986 | 14,239 | 12,979 | 14,584 | 15,207 | 10,927 | 9,982 | 8,117 | 8,944 |
| 2007 | 10,408 | 8,908 | 12,937 | 13,822 | 15,147 | 14,393 | 14,181 | 13,886 | 10,604 | 9,934 | 8,477 | 9,963 |
| 2008 | 10,263 | 10,260 | 13,212 | 13,957 | 15,157 | 14,177 | 14,731 | 14,185 | 7,669 | 8,802 | 8,314 | 8,009 |
| 2009 | 8,626 | 8,650 | 12,917 | 13,908 | 14,083 | 13,974 | 14,190 | 15,242 | 11,220 | 9,738 | 9,361 | 11,093 |
| 2010 | 11,307 | 10,022 | 15,130 | 15,881 | 15,761 | 15,696 | 15,677 | 13,949 | 11,872 | 10,854 | 9,307 | 10,848 |
| 2011 | 10,290 | 9,050 | 12,380 | 13,855 | 15,033 | 14,794 | 15,180 | 14,499 | 11,273 | 10,094 | 9,059 | 9,292 |
| 2012 | 9,648 | 10,092 | 13,670 | 15,606 | 15,984 | 14,884 | 15,789 | 14,015 | 10,409 | 10,292 | 9,454 | 10,300 |
| 2013 | 9,452 | 9,469 | 13,239 | 14,912 | 16,491 | 14,924 | 15,841 | 15,373 | 12,338 | 9,508 | 8,183 | 10,220 |
| 2014 | 10,280 | 10,193 | 14,011 | 15,937 | 15,691 | 15,297 | 16,426 | 16,476 | 11,232 | 9,611 | 9,682 | 10,183 |
| 2015 | 9,723 | 8,630 | 11,875 | 14,504 | 16,153 | 15,007 | 15,665 | 15,801 | 10,977 | 9,775 | 8,903 | 9,114 |
| 2016 | 9,163 | 9,614 | 13,926 | 15,336 | 16,581 | 15,299 | 16,025 | 15,055 | 12,559 | 10,323 | 9,135 | 9,781 |
| 2017 | 9,244 | 8,655 | 14,030 | 15,590 | 16,851 | 16,346 | 16,447 | 15,182 | 8,777 | 10,971 | 9,869 | 10,020 |
| 2018 | 10,242 | 9,307 | 13,469 | 14,421 | 15,122 | 15,348 | 16,360 | 17,264 | 13,349 | 11,386 | 10,486 | 10,616 |
| 2019 | 9,617 | 9,360 | 13,345 | 15,014 | 16,396 | 15,529 | 15,922 | 15,132 | 11,534 | 9,650 | 7,961 | 9,696 |
| 2020 | 10,522 | 8,797 | 13,311 | 13,023 | 13,309 | 13,681 | 14,578 | 13,634 | 10,991 | 10,413 | 10,116 | 10,688 |
| 2021 | 10,408 | 7,524 | 12,426 | 14,928 | 18,102 | 16,776 | 16,809 | 15,649 | 12,198 | 11,952 | 11,166 | 10,821 |
| 2022 | -- | -- | -- | -- | -- | -- | -- | -- | -- | -- | -- | -- |
| 2023 | -- | -- | -- | -- | -- | -- | -- | -- | -- | -- | -- | -- |
| 2024 | -- | |||||||||||
| - = No Data Reported; -- = Not Applicable; NA = Not Available; W = Withheld to avoid disclosure of individual company data. |
| Release Date: 3/29/2024 |
| Next Release Date: 4/30/2024 |