|
Download Data (XLS File) |
|
||||||||
|
||||||||
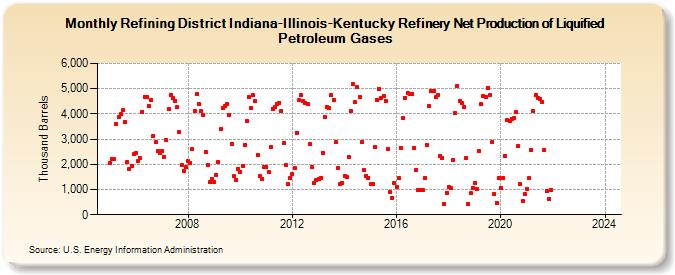
| Refining District Indiana-Illinois-Kentucky Refinery Net Production of Liquified Petroleum Gases (Thousand Barrels) | ||||||||
| Year | Jan | Feb | Mar | Apr | May | Jun | Jul | Aug | Sep | Oct | Nov | Dec |
|---|---|---|---|---|---|---|---|---|---|---|---|---|
| 2005 | 2,037 | 2,196 | 2,196 | 3,588 | 3,862 | 3,980 | 4,137 | 3,689 | 2,072 | 1,830 | 1,943 | 2,398 |
| 2006 | 2,446 | 2,126 | 2,245 | 4,088 | 4,681 | 4,667 | 4,303 | 4,549 | 3,118 | 2,875 | 2,537 | 2,468 |
| 2007 | 2,524 | 2,294 | 2,959 | 4,189 | 4,764 | 4,650 | 4,523 | 4,268 | 3,280 | 1,979 | 1,753 | 1,879 |
| 2008 | 2,117 | 2,058 | 2,596 | 4,127 | 4,770 | 4,380 | 4,103 | 3,950 | 2,496 | 1,992 | 1,310 | 1,405 |
| 2009 | 1,311 | 1,588 | 2,084 | 3,401 | 4,214 | 4,304 | 4,400 | 3,957 | 2,804 | 1,532 | 1,396 | 1,825 |
| 2010 | 1,714 | 1,945 | 2,782 | 3,714 | 4,663 | 4,230 | 4,747 | 4,510 | 2,365 | 1,539 | 1,431 | 1,894 |
| 2011 | 1,906 | 1,682 | 2,701 | 4,210 | 4,264 | 4,397 | 4,443 | 4,107 | 2,834 | 1,970 | 1,200 | 1,472 |
| 2012 | 1,600 | 1,860 | 3,261 | 4,538 | 4,739 | 4,495 | 4,421 | 4,407 | 2,788 | 1,891 | 1,249 | 1,360 |
| 2013 | 1,410 | 1,472 | 2,464 | 3,885 | 4,259 | 4,221 | 4,737 | 4,560 | 2,872 | 1,870 | 1,238 | 1,270 |
| 2014 | 1,555 | 1,499 | 2,292 | 4,107 | 5,174 | 4,459 | 5,049 | 4,653 | 2,897 | 1,776 | 1,544 | 1,470 |
| 2015 | 1,221 | 1,217 | 2,682 | 4,552 | 5,004 | 4,641 | 4,724 | 4,515 | 2,602 | 897 | 673 | 1,255 |
| 2016 | 1,110 | 1,458 | 2,653 | 3,842 | 4,642 | 4,843 | 4,808 | 4,808 | 2,656 | 1,784 | 986 | 969 |
| 2017 | 964 | 1,462 | 2,780 | 4,322 | 4,889 | 4,901 | 4,652 | 4,756 | 2,326 | 2,259 | 433 | 878 |
| 2018 | 1,106 | 1,043 | 2,164 | 4,030 | 5,125 | 4,511 | 4,429 | 4,272 | 2,256 | 433 | 851 | 1,077 |
| 2019 | 1,264 | 1,017 | 2,520 | 4,386 | 4,701 | 4,668 | 5,033 | 4,737 | 2,886 | 830 | 467 | 1,437 |
| 2020 | 1,077 | 1,458 | 2,342 | 3,746 | 3,708 | 3,811 | 3,831 | 4,069 | 2,745 | 1,209 | 526 | 821 |
| 2021 | 1,004 | 1,444 | 2,579 | 4,130 | 4,749 | 4,642 | 4,574 | 4,476 | 2,577 | 926 | 637 | 994 |
| 2022 | -- | -- | -- | -- | -- | -- | -- | -- | -- | -- | -- | -- |
| 2023 | -- | -- | -- | -- | -- | -- | -- | -- | -- | -- | -- | -- |
| 2024 | -- | |||||||||||
| - = No Data Reported; -- = Not Applicable; NA = Not Available; W = Withheld to avoid disclosure of individual company data. |
| Release Date: 3/29/2024 |
| Next Release Date: 4/30/2024 |