|
Download Data (XLS File) |
|
||||||||
|
||||||||
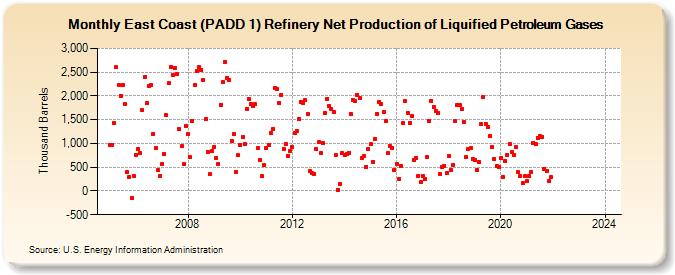
| East Coast (PADD 1) Refinery Net Production of Liquified Petroleum Gases (Thousand Barrels) | ||||||||
| Year | Jan | Feb | Mar | Apr | May | Jun | Jul | Aug | Sep | Oct | Nov | Dec |
|---|---|---|---|---|---|---|---|---|---|---|---|---|
| 2005 | 963 | 966 | 1,440 | 2,600 | 2,229 | 1,999 | 2,233 | 1,831 | 390 | 300 | -141 | 313 |
| 2006 | 763 | 883 | 793 | 1,707 | 2,398 | 1,857 | 2,217 | 2,221 | 1,203 | 901 | 432 | 316 |
| 2007 | 572 | 787 | 1,595 | 2,266 | 2,606 | 2,450 | 2,579 | 2,463 | 1,300 | 938 | 561 | 1,375 |
| 2008 | 1,202 | 708 | 1,470 | 2,231 | 2,531 | 2,607 | 2,549 | 2,344 | 1,508 | 829 | 349 | 839 |
| 2009 | 926 | 698 | 571 | 1,814 | 2,283 | 2,723 | 2,382 | 2,338 | 1,061 | 1,194 | 409 | 749 |
| 2010 | 958 | 1,135 | 981 | 1,729 | 1,940 | 1,820 | 1,796 | 1,821 | 897 | 654 | 310 | 545 |
| 2011 | 906 | 977 | 1,219 | 1,304 | 2,171 | 2,141 | 1,859 | 2,027 | 886 | 988 | 736 | 839 |
| 2012 | 923 | 1,217 | 1,265 | 1,512 | 1,878 | 1,855 | 1,905 | 1,614 | 417 | 382 | 361 | 873 |
| 2013 | 1,020 | 789 | 1,010 | 1,637 | 1,939 | 1,785 | 1,730 | 1,664 | 747 | 26 | 155 | 789 |
| 2014 | 750 | 772 | 805 | 1,616 | 1,924 | 1,884 | 2,024 | 1,959 | 697 | 732 | 510 | 883 |
| 2015 | 979 | 617 | 1,085 | 1,627 | 1,867 | 1,826 | 1,659 | 1,475 | 794 | 945 | 913 | 436 |
| 2016 | 559 | 258 | 521 | 1,426 | 1,889 | 1,644 | 1,436 | 1,577 | 644 | 690 | 324 | 180 |
| 2017 | 316 | 242 | 718 | 1,475 | 1,895 | 1,773 | 1,677 | 1,647 | 354 | 511 | 531 | 369 |
| 2018 | 732 | 441 | 544 | 1,472 | 1,811 | 1,799 | 1,726 | 1,458 | 710 | 888 | 903 | 674 |
| 2019 | 648 | 438 | 606 | 1,400 | 1,967 | 1,414 | 1,352 | 1,159 | 930 | 676 | 518 | 499 |
| 2020 | 692 | 297 | 635 | 761 | 978 | 824 | 758 | 927 | 396 | 314 | 166 | 308 |
| 2021 | 200 | 307 | 404 | 1,016 | 981 | 1,120 | 1,148 | 1,143 | 462 | 421 | 208 | 288 |
| 2022 | -- | -- | -- | -- | -- | -- | -- | -- | -- | -- | -- | -- |
| 2023 | -- | -- | -- | -- | -- | -- | -- | -- | -- | -- | -- | -- |
| 2024 | -- | |||||||||||
| - = No Data Reported; -- = Not Applicable; NA = Not Available; W = Withheld to avoid disclosure of individual company data. |
| Release Date: 3/29/2024 |
| Next Release Date: 4/30/2024 |