|
Download Data (XLS File) |
|
||||||||
|
||||||||
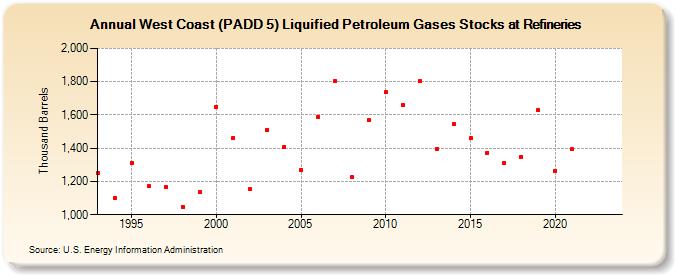
| West Coast (PADD 5) Liquified Petroleum Gases Stocks at Refineries (Thousand Barrels) | ||||||||
| Decade | Year-0 | Year-1 | Year-2 | Year-3 | Year-4 | Year-5 | Year-6 | Year-7 | Year-8 | Year-9 |
|---|---|---|---|---|---|---|---|---|---|---|
| 1990's | 1,252 | 1,102 | 1,311 | 1,171 | 1,167 | 1,049 | 1,135 | |||
| 2000's | 1,650 | 1,462 | 1,153 | 1,512 | 1,409 | 1,268 | 1,589 | 1,804 | 1,225 | 1,568 |
| 2010's | 1,736 | 1,660 | 1,803 | 1,397 | 1,544 | 1,462 | 1,374 | 1,310 | 1,346 | 1,628 |
| 2020's | 1,265 | 1,393 | -- | -- |
| - = No Data Reported; -- = Not Applicable; NA = Not Available; W = Withheld to avoid disclosure of individual company data. |
| Release Date: 3/29/2024 |
| Next Release Date: 8/30/2024 |