|
Download Data (XLS File) |
|
||||||||
|
||||||||
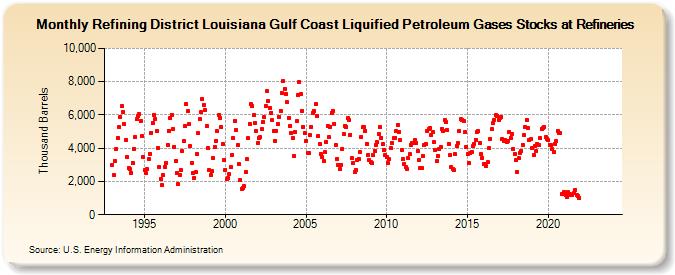
| Refining District Louisiana Gulf Coast Liquified Petroleum Gases Stocks at Refineries (Thousand Barrels) | ||||||||
| Year | Jan | Feb | Mar | Apr | May | Jun | Jul | Aug | Sep | Oct | Nov | Dec |
|---|---|---|---|---|---|---|---|---|---|---|---|---|
| 1993 | 3,008 | 2,386 | 3,236 | 3,960 | 4,630 | 5,258 | 5,890 | 6,527 | 6,147 | 5,428 | 4,514 | 3,465 |
| 1994 | 2,819 | 2,722 | 2,527 | 3,114 | 3,976 | 4,676 | 5,735 | 5,918 | 6,052 | 5,647 | 4,738 | 3,476 |
| 1995 | 2,677 | 2,479 | 2,726 | 3,346 | 3,680 | 4,933 | 5,534 | 6,012 | 5,744 | 5,054 | 4,035 | 2,856 |
| 1996 | 2,155 | 1,789 | 2,378 | 2,889 | 3,135 | 4,201 | 5,052 | 5,791 | 6,021 | 5,148 | 4,095 | 3,217 |
| 1997 | 2,531 | 1,836 | 2,404 | 2,684 | 3,828 | 4,421 | 5,343 | 6,670 | 6,218 | 5,450 | 4,115 | 3,139 |
| 1998 | 2,485 | 2,236 | 2,548 | 3,659 | 4,883 | 5,735 | 6,159 | 6,950 | 6,587 | 6,318 | 5,336 | 4,019 |
| 1999 | 2,688 | 2,386 | 2,621 | 3,391 | 4,059 | 4,458 | 5,011 | 5,970 | 5,822 | 5,268 | 4,251 | 3,267 |
| 2000 | 2,711 | 2,126 | 2,182 | 2,430 | 2,861 | 3,594 | 4,604 | 5,623 | 5,105 | 4,176 | 3,053 | 2,075 |
| 2001 | 1,568 | 1,610 | 1,715 | 2,568 | 3,329 | 4,586 | 5,476 | 6,634 | 6,530 | 5,985 | 5,541 | 5,033 |
| 2002 | 4,323 | 4,631 | 4,666 | 5,137 | 5,588 | 5,852 | 6,540 | 7,427 | 6,817 | 6,434 | 6,133 | 5,680 |
| 2003 | 5,048 | 4,448 | 5,052 | 5,453 | 5,899 | 6,261 | 7,322 | 8,025 | 7,585 | 7,259 | 6,756 | 5,840 |
| 2004 | 5,352 | 4,924 | 4,604 | 3,532 | 4,985 | 5,612 | 7,179 | 7,984 | 7,260 | 6,264 | 5,280 | 4,897 |
| 2005 | 4,440 | 3,714 | 3,721 | 4,772 | 5,294 | 6,127 | 6,246 | 6,642 | 5,950 | 4,739 | 4,245 | 3,660 |
| 2006 | 3,472 | 3,249 | 3,755 | 4,379 | 5,344 | 4,645 | 5,293 | 6,127 | 6,244 | 5,479 | 4,204 | 3,369 |
| 2007 | 2,977 | 2,727 | 3,019 | 3,961 | 4,856 | 5,359 | 5,303 | 5,789 | 5,687 | 4,812 | 3,386 | 3,100 |
| 2008 | 2,570 | 2,688 | 3,304 | 3,372 | 3,774 | 4,667 | 5,260 | 5,253 | 5,058 | 4,275 | 3,601 | 3,279 |
| 2009 | 3,152 | 3,090 | 3,584 | 3,846 | 4,184 | 4,348 | 4,843 | 5,287 | 4,631 | 4,242 | 3,894 | 3,583 |
| 2010 | 3,483 | 3,097 | 3,321 | 3,995 | 4,312 | 4,609 | 4,638 | 5,029 | 5,394 | 4,975 | 4,473 | 3,896 |
| 2011 | 3,338 | 3,075 | 2,864 | 2,741 | 3,392 | 3,622 | 4,196 | 4,337 | 4,303 | 4,482 | 4,316 | 3,817 |
| 2012 | 3,299 | 2,794 | 2,820 | 3,522 | 4,168 | 4,281 | 5,023 | 5,152 | 5,224 | 4,810 | 4,961 | 4,349 |
| 2013 | 3,864 | 3,227 | 3,545 | 3,921 | 4,067 | 5,172 | 5,049 | 5,673 | 5,561 | 5,089 | 4,268 | 3,584 |
| 2014 | 2,843 | 2,768 | 2,688 | 3,625 | 4,148 | 4,305 | 5,030 | 5,726 | 5,713 | 5,640 | 4,945 | 4,080 |
| 2015 | 3,649 | 3,129 | 3,683 | 3,791 | 4,112 | 4,275 | 4,503 | 4,956 | 5,011 | 4,285 | 3,626 | 3,415 |
| 2016 | 3,062 | 3,058 | 2,925 | 3,142 | 3,982 | 4,581 | 5,132 | 5,492 | 5,714 | 6,006 | 5,958 | 5,712 |
| 2017 | 5,801 | 5,900 | 4,559 | 4,458 | 4,480 | 4,383 | 4,437 | 4,983 | 4,611 | 4,859 | 3,959 | 3,651 |
| 2018 | 3,268 | 2,589 | 3,387 | 3,724 | 3,817 | 4,218 | 4,763 | 5,303 | 5,701 | 5,217 | 4,481 | 4,539 |
| 2019 | 4,036 | 3,583 | 4,134 | 3,834 | 4,247 | 4,183 | 4,599 | 5,167 | 5,193 | 5,265 | 4,666 | 4,559 |
| 2020 | 4,466 | 4,220 | 4,191 | 3,961 | 3,774 | 4,260 | 4,403 | 5,045 | 4,941 | 4,916 | 1,240 | 1,245 |
| 2021 | 1,340 | 1,194 | 1,087 | 1,346 | 1,226 | 1,195 | 1,194 | 1,306 | 1,493 | 1,165 | 1,153 | 1,014 |
| 2022 | -- | -- | -- | -- | -- | -- | -- | -- | -- | -- | -- | -- |
| 2023 | -- | -- | -- | -- | -- | -- | -- | -- | -- | -- | -- | -- |
| 2024 | -- | |||||||||||
| - = No Data Reported; -- = Not Applicable; NA = Not Available; W = Withheld to avoid disclosure of individual company data. |
| Release Date: 3/29/2024 |
| Next Release Date: 4/30/2024 |