|
Download Data (XLS File) |
|
||||||||
|
||||||||
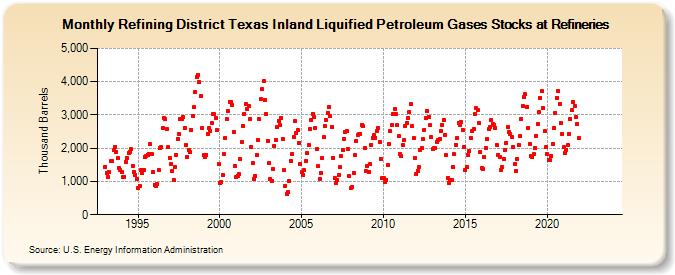
| Refining District Texas Inland Liquified Petroleum Gases Stocks at Refineries (Thousand Barrels) | ||||||||
| Year | Jan | Feb | Mar | Apr | May | Jun | Jul | Aug | Sep | Oct | Nov | Dec |
|---|---|---|---|---|---|---|---|---|---|---|---|---|
| 1993 | 1,439 | 1,253 | 1,144 | 1,280 | 1,604 | 1,617 | 1,931 | 2,034 | 1,893 | 1,701 | 1,398 | 1,335 |
| 1994 | 1,286 | 1,120 | 1,136 | 1,593 | 1,702 | 1,850 | 1,894 | 1,964 | 1,455 | 1,278 | 1,204 | 1,082 |
| 1995 | 818 | 868 | 1,334 | 1,248 | 1,357 | 1,738 | 1,777 | 1,807 | 1,837 | 2,112 | 1,820 | 1,280 |
| 1996 | 903 | 868 | 930 | 1,343 | 1,995 | 2,032 | 2,603 | 2,905 | 2,866 | 2,581 | 2,035 | 1,717 |
| 1997 | 1,515 | 1,321 | 1,054 | 1,442 | 1,807 | 2,279 | 2,423 | 2,891 | 2,881 | 2,931 | 2,608 | 2,095 |
| 1998 | 1,737 | 1,951 | 1,871 | 2,551 | 2,973 | 3,230 | 3,674 | 4,125 | 4,197 | 3,987 | 3,563 | 2,597 |
| 1999 | 1,784 | 1,735 | 1,807 | 2,434 | 2,605 | 2,520 | 2,745 | 3,027 | 3,018 | 2,912 | 2,539 | 1,527 |
| 2000 | 959 | 986 | 1,195 | 1,827 | 2,300 | 2,868 | 3,120 | 3,383 | 3,392 | 3,292 | 2,495 | 1,476 |
| 2001 | 1,131 | 1,173 | 1,216 | 1,663 | 2,192 | 2,681 | 3,039 | 3,329 | 3,165 | 3,257 | 2,883 | 2,034 |
| 2002 | 1,557 | 1,067 | 1,165 | 1,788 | 2,248 | 2,866 | 3,480 | 3,775 | 4,013 | 3,455 | 3,029 | 2,230 |
| 2003 | 1,546 | 1,081 | 1,002 | 1,375 | 2,070 | 2,235 | 2,637 | 2,821 | 2,694 | 2,907 | 2,288 | 1,330 |
| 2004 | 866 | 627 | 674 | 1,012 | 1,626 | 1,826 | 2,329 | 2,806 | 2,446 | 2,554 | 2,168 | 1,536 |
| 2005 | 1,271 | 1,204 | 1,338 | 1,610 | 1,850 | 2,094 | 2,571 | 2,857 | 3,036 | 2,942 | 2,613 | 1,970 |
| 2006 | 1,454 | 1,071 | 1,244 | 1,707 | 2,326 | 2,665 | 2,856 | 3,071 | 3,250 | 2,963 | 2,637 | 1,715 |
| 2007 | 1,091 | 953 | 1,054 | 1,184 | 1,421 | 1,751 | 1,956 | 2,287 | 2,478 | 2,508 | 1,984 | 1,151 |
| 2008 | 794 | 844 | 1,254 | 1,793 | 2,207 | 2,395 | 2,422 | 2,428 | 2,706 | 2,655 | 1,999 | 1,308 |
| 2009 | 1,475 | 1,278 | 1,511 | 2,107 | 2,317 | 2,386 | 2,316 | 2,509 | 2,605 | 2,198 | 1,681 | 1,098 |
| 2010 | 1,095 | 980 | 1,056 | 1,487 | 2,131 | 2,508 | 2,696 | 3,023 | 3,167 | 3,016 | 2,684 | 2,354 |
| 2011 | 1,829 | 1,764 | 2,099 | 2,234 | 2,673 | 2,762 | 2,919 | 3,094 | 3,328 | 2,657 | 2,307 | 1,719 |
| 2012 | 1,210 | 1,324 | 1,426 | 1,931 | 2,009 | 2,275 | 2,557 | 2,895 | 3,111 | 2,941 | 2,686 | 2,322 |
| 2013 | 1,970 | 1,995 | 2,010 | 2,189 | 2,261 | 2,271 | 2,531 | 2,705 | 2,848 | 2,411 | 1,788 | 1,114 |
| 2014 | 949 | 1,049 | 1,037 | 1,431 | 1,813 | 2,106 | 2,317 | 2,759 | 2,688 | 2,788 | 2,543 | 2,029 |
| 2015 | 1,339 | 1,440 | 1,809 | 1,901 | 2,320 | 2,516 | 2,579 | 3,030 | 3,195 | 3,150 | 2,766 | 1,896 |
| 2016 | 1,414 | 1,382 | 1,729 | 1,993 | 2,291 | 2,564 | 2,622 | 2,842 | 2,727 | 2,700 | 2,607 | 2,096 |
| 2017 | 1,803 | 1,727 | 1,351 | 1,429 | 1,685 | 1,946 | 2,157 | 2,639 | 2,494 | 2,425 | 2,350 | 2,042 |
| 2018 | 1,517 | 1,327 | 1,687 | 2,099 | 2,366 | 2,889 | 3,283 | 3,545 | 3,623 | 3,250 | 2,618 | 2,130 |
| 2019 | 1,754 | 1,728 | 1,812 | 2,000 | 2,374 | 2,718 | 3,079 | 3,513 | 3,715 | 3,209 | 2,505 | 2,028 |
| 2020 | 1,814 | 1,656 | 1,641 | 1,758 | 2,126 | 2,614 | 3,065 | 3,516 | 3,733 | 3,323 | 2,772 | 2,438 |
| 2021 | 2,028 | 1,844 | 1,954 | 2,096 | 2,427 | 2,878 | 3,139 | 3,393 | 3,274 | 2,933 | 2,726 | 2,298 |
| 2022 | -- | -- | -- | -- | -- | -- | -- | -- | -- | -- | -- | -- |
| 2023 | -- | -- | -- | -- | -- | -- | -- | -- | -- | -- | -- | -- |
| 2024 | -- | |||||||||||
| - = No Data Reported; -- = Not Applicable; NA = Not Available; W = Withheld to avoid disclosure of individual company data. |
| Release Date: 3/29/2024 |
| Next Release Date: 4/30/2024 |
Referring Pages: