|
Download Data (XLS File) |
|
||||||||
|
||||||||
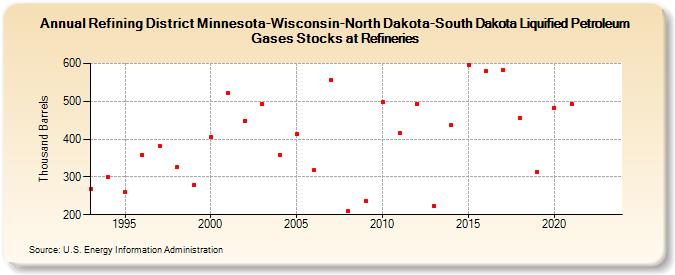
| Refining District Minnesota-Wisconsin-North Dakota-South Dakota Liquified Petroleum Gases Stocks at Refineries (Thousand Barrels) | ||||||||
| Decade | Year-0 | Year-1 | Year-2 | Year-3 | Year-4 | Year-5 | Year-6 | Year-7 | Year-8 | Year-9 |
|---|---|---|---|---|---|---|---|---|---|---|
| 1990's | 269 | 300 | 259 | 359 | 382 | 325 | 279 | |||
| 2000's | 405 | 522 | 449 | 493 | 359 | 413 | 317 | 556 | 209 | 236 |
| 2010's | 497 | 417 | 493 | 223 | 436 | 597 | 580 | 584 | 456 | 313 |
| 2020's | 483 | 493 | -- | -- |
| - = No Data Reported; -- = Not Applicable; NA = Not Available; W = Withheld to avoid disclosure of individual company data. |
| Release Date: 3/29/2024 |
| Next Release Date: 8/30/2024 |