|
Download Data (XLS File) |
|
||||||||
|
||||||||
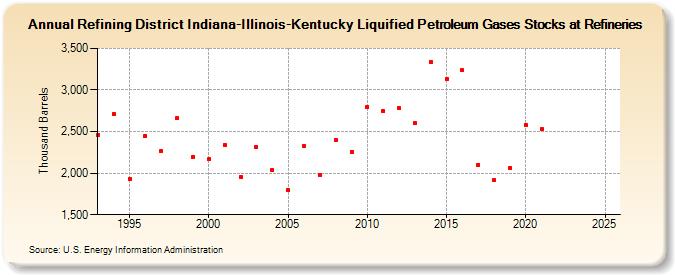
| Refining District Indiana-Illinois-Kentucky Liquified Petroleum Gases Stocks at Refineries (Thousand Barrels) | ||||||||
| Decade | Year-0 | Year-1 | Year-2 | Year-3 | Year-4 | Year-5 | Year-6 | Year-7 | Year-8 | Year-9 |
|---|---|---|---|---|---|---|---|---|---|---|
| 1990's | 2,461 | 2,715 | 1,932 | 2,447 | 2,266 | 2,661 | 2,195 | |||
| 2000's | 2,165 | 2,344 | 1,956 | 2,314 | 2,038 | 1,799 | 2,327 | 1,981 | 2,399 | 2,259 |
| 2010's | 2,795 | 2,746 | 2,779 | 2,598 | 3,337 | 3,134 | 3,236 | 2,100 | 1,913 | 2,062 |
| 2020's | 2,584 | 2,528 | -- | -- |
| - = No Data Reported; -- = Not Applicable; NA = Not Available; W = Withheld to avoid disclosure of individual company data. |
| Release Date: 8/30/2024 |
| Next Release Date: 8/29/2025 |