|
Download Data (XLS File) |
|
||||||||
|
||||||||
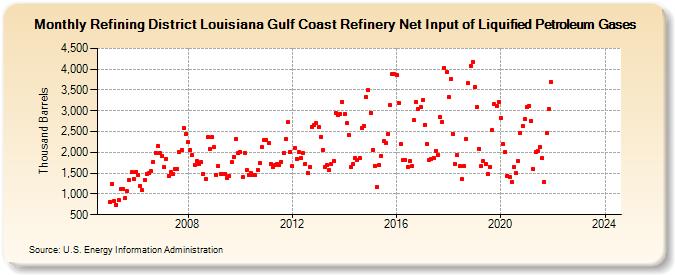
| Refining District Louisiana Gulf Coast Refinery Net Input of Liquified Petroleum Gases (Thousand Barrels) | ||||||||
| Year | Jan | Feb | Mar | Apr | May | Jun | Jul | Aug | Sep | Oct | Nov | Dec |
|---|---|---|---|---|---|---|---|---|---|---|---|---|
| 2005 | 816 | 1,239 | 826 | 728 | 846 | 1,110 | 1,119 | 901 | 1,061 | 1,330 | 1,517 | 1,365 |
| 2006 | 1,534 | 1,453 | 1,198 | 1,090 | 1,338 | 1,488 | 1,493 | 1,544 | 1,771 | 1,995 | 2,153 | 1,981 |
| 2007 | 1,906 | 1,647 | 1,850 | 1,433 | 1,521 | 1,486 | 1,597 | 1,607 | 2,016 | 2,066 | 2,585 | 2,439 |
| 2008 | 2,251 | 2,057 | 1,942 | 1,706 | 1,790 | 1,717 | 1,766 | 1,488 | 1,369 | 2,361 | 2,089 | 2,363 |
| 2009 | 2,117 | 1,459 | 1,668 | 1,488 | 1,488 | 1,484 | 1,393 | 1,427 | 1,767 | 1,887 | 2,326 | 1,975 |
| 2010 | 2,011 | 1,397 | 1,994 | 1,569 | 1,461 | 1,498 | 1,464 | 1,448 | 1,581 | 1,748 | 2,125 | 2,294 |
| 2011 | 2,285 | 2,234 | 1,726 | 1,636 | 1,698 | 1,723 | 1,693 | 1,779 | 1,993 | 2,326 | 2,724 | 2,016 |
| 2012 | 1,665 | 2,106 | 1,851 | 2,009 | 1,866 | 1,984 | 1,730 | 1,507 | 1,655 | 2,616 | 2,664 | 2,709 |
| 2013 | 2,610 | 2,379 | 2,047 | 1,654 | 1,684 | 1,570 | 1,725 | 1,795 | 2,944 | 2,887 | 2,921 | 3,217 |
| 2014 | 2,913 | 2,701 | 2,425 | 1,647 | 1,708 | 1,867 | 1,811 | 1,852 | 2,589 | 2,639 | 3,330 | 3,493 |
| 2015 | 2,955 | 2,060 | 1,678 | 1,170 | 1,684 | 1,924 | 2,265 | 2,226 | 2,451 | 3,127 | 3,891 | 3,882 |
| 2016 | 3,866 | 3,195 | 2,197 | 1,816 | 1,816 | 1,656 | 1,785 | 1,666 | 2,767 | 3,217 | 3,047 | 3,084 |
| 2017 | 3,266 | 2,665 | 2,203 | 1,814 | 1,850 | 1,867 | 2,042 | 1,931 | 2,842 | 2,735 | 4,034 | 3,938 |
| 2018 | 3,329 | 3,765 | 2,436 | 1,721 | 1,927 | 1,661 | 1,351 | 1,664 | 2,331 | 3,658 | 4,084 | 4,175 |
| 2019 | 3,569 | 3,089 | 2,090 | 1,670 | 1,783 | 1,727 | 1,488 | 1,656 | 2,527 | 3,152 | 3,104 | 3,222 |
| 2020 | 2,830 | 2,196 | 2,011 | 1,438 | 1,411 | 1,292 | 1,654 | 1,503 | 1,795 | 2,454 | 2,643 | 2,793 |
| 2021 | 3,084 | 3,121 | 2,763 | 1,590 | 2,007 | 2,021 | 2,123 | 1,863 | 1,294 | 2,466 | 3,052 | 3,693 |
| 2022 | -- | -- | -- | -- | -- | -- | -- | -- | -- | -- | -- | -- |
| 2023 | -- | -- | -- | -- | -- | -- | -- | -- | -- | -- | -- | -- |
| 2024 | -- | -- | -- | -- | -- | -- | ||||||
| - = No Data Reported; -- = Not Applicable; NA = Not Available; W = Withheld to avoid disclosure of individual company data. |
| Release Date: 8/30/2024 |
| Next Release Date: 9/30/2024 |