|
Download Data (XLS File) |
|
||||||||
|
||||||||
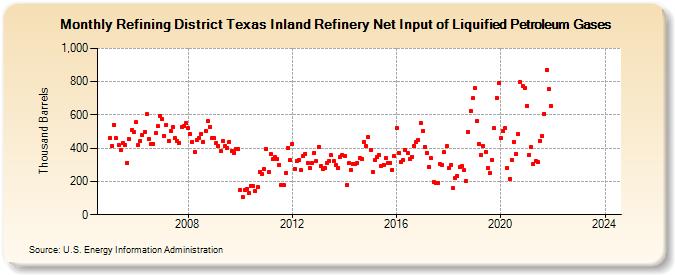
| Refining District Texas Inland Refinery Net Input of Liquified Petroleum Gases (Thousand Barrels) | ||||||||
| Year | Jan | Feb | Mar | Apr | May | Jun | Jul | Aug | Sep | Oct | Nov | Dec |
|---|---|---|---|---|---|---|---|---|---|---|---|---|
| 2005 | 463 | 416 | 541 | 459 | 418 | 390 | 432 | 421 | 312 | 454 | 509 | 498 |
| 2006 | 556 | 419 | 445 | 481 | 499 | 604 | 457 | 426 | 427 | 489 | 531 | 595 |
| 2007 | 574 | 475 | 542 | 445 | 502 | 525 | 459 | 444 | 433 | 525 | 531 | 551 |
| 2008 | 520 | 486 | 440 | 377 | 448 | 461 | 488 | 440 | 504 | 563 | 530 | 459 |
| 2009 | 460 | 434 | 414 | 382 | 441 | 415 | 403 | 439 | 383 | 372 | 394 | 397 |
| 2010 | 149 | 107 | 147 | 155 | 130 | 175 | 172 | 144 | 164 | 257 | 246 | 276 |
| 2011 | 396 | 256 | 366 | 332 | 344 | 336 | 301 | 178 | 177 | 252 | 402 | 329 |
| 2012 | 427 | 277 | 325 | 331 | 267 | 353 | 368 | 313 | 282 | 312 | 373 | 321 |
| 2013 | 410 | 292 | 274 | 282 | 311 | 323 | 357 | 320 | 297 | 282 | 346 | 360 |
| 2014 | 354 | 176 | 308 | 270 | 307 | 302 | 311 | 339 | 335 | 436 | 411 | 467 |
| 2015 | 392 | 259 | 329 | 348 | 360 | 294 | 301 | 340 | 313 | 312 | 271 | 352 |
| 2016 | 521 | 374 | 317 | 329 | 391 | 374 | 333 | 347 | 416 | 435 | 448 | 553 |
| 2017 | 506 | 409 | 372 | 289 | 338 | 196 | 193 | 192 | 304 | 299 | 375 | 411 |
| 2018 | 279 | 301 | 158 | 220 | 233 | 284 | 291 | 268 | 200 | 500 | 625 | 700 |
| 2019 | 761 | 563 | 428 | 361 | 412 | 378 | 281 | 250 | 331 | 521 | 704 | 793 |
| 2020 | 461 | 502 | 521 | 281 | 215 | 331 | 440 | 368 | 484 | 796 | 773 | 763 |
| 2021 | 656 | 361 | 407 | 307 | 321 | 314 | 446 | 476 | 608 | 870 | 753 | 655 |
| 2022 | -- | -- | -- | -- | -- | -- | -- | -- | -- | -- | -- | -- |
| 2023 | -- | -- | -- | -- | -- | -- | -- | -- | -- | -- | -- | -- |
| 2024 | -- | |||||||||||
| - = No Data Reported; -- = Not Applicable; NA = Not Available; W = Withheld to avoid disclosure of individual company data. |
| Release Date: 3/29/2024 |
| Next Release Date: 4/30/2024 |