|
Download Data (XLS File) |
|
||||||||
|
||||||||
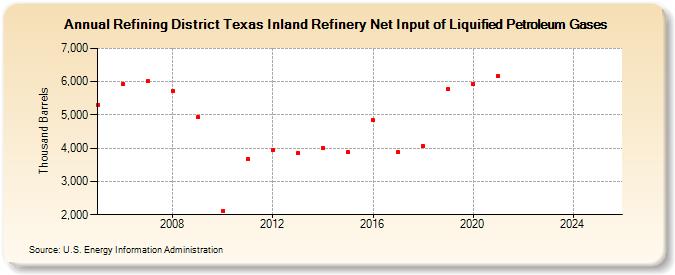
| Refining District Texas Inland Refinery Net Input of Liquified Petroleum Gases (Thousand Barrels) | ||||||||
| Decade | Year-0 | Year-1 | Year-2 | Year-3 | Year-4 | Year-5 | Year-6 | Year-7 | Year-8 | Year-9 |
|---|---|---|---|---|---|---|---|---|---|---|
| 2000's | 5,313 | 5,929 | 6,006 | 5,716 | 4,934 | |||||
| 2010's | 2,122 | 3,669 | 3,949 | 3,854 | 4,016 | 3,871 | 4,838 | 3,884 | 4,059 | 5,783 |
| 2020's | 5,935 | 6,174 | -- | -- |
| - = No Data Reported; -- = Not Applicable; NA = Not Available; W = Withheld to avoid disclosure of individual company data. |
| Release Date: 3/29/2024 |
| Next Release Date: 8/30/2024 |