|
Download Data (XLS File) |
|
||||||||
|
||||||||
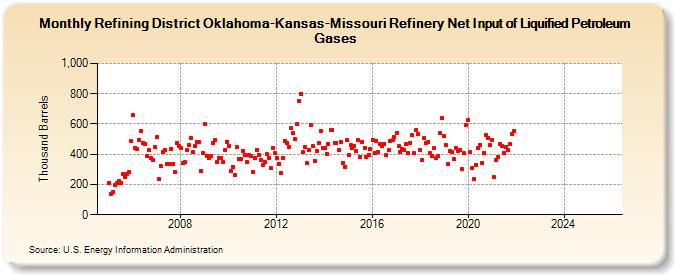
| Refining District Oklahoma-Kansas-Missouri Refinery Net Input of Liquified Petroleum Gases (Thousand Barrels) | ||||||||
| Year | Jan | Feb | Mar | Apr | May | Jun | Jul | Aug | Sep | Oct | Nov | Dec |
|---|---|---|---|---|---|---|---|---|---|---|---|---|
| 2005 | 211 | 137 | 152 | 197 | 213 | 224 | 211 | 269 | 247 | 271 | 285 | 486 |
| 2006 | 658 | 444 | 435 | 496 | 556 | 477 | 467 | 386 | 426 | 373 | 361 | 448 |
| 2007 | 515 | 233 | 325 | 414 | 428 | 335 | 336 | 437 | 338 | 280 | 477 | 456 |
| 2008 | 442 | 344 | 346 | 426 | 458 | 508 | 414 | 457 | 481 | 482 | 288 | 408 |
| 2009 | 599 | 390 | 378 | 389 | 476 | 493 | 349 | 375 | 377 | 349 | 425 | 481 |
| 2010 | 457 | 292 | 317 | 262 | 446 | 369 | 371 | 419 | 394 | 350 | 394 | 387 |
| 2011 | 283 | 376 | 431 | 394 | 365 | 332 | 350 | 401 | 377 | 309 | 442 | 405 |
| 2012 | 377 | 334 | 275 | 373 | 490 | 476 | 450 | 572 | 538 | 503 | 603 | 753 |
| 2013 | 800 | 415 | 450 | 340 | 428 | 596 | 452 | 355 | 422 | 474 | 552 | 438 |
| 2014 | 441 | 403 | 470 | 559 | 563 | 476 | 475 | 426 | 483 | 344 | 316 | 496 |
| 2015 | 398 | 462 | 442 | 453 | 418 | 492 | 382 | 480 | 442 | 379 | 397 | 432 |
| 2016 | 497 | 409 | 490 | 413 | 468 | 456 | 468 | 396 | 427 | 487 | 492 | 511 |
| 2017 | 542 | 452 | 417 | 434 | 428 | 465 | 408 | 476 | 527 | 405 | 561 | 532 |
| 2018 | 428 | 365 | 510 | 471 | 482 | 405 | 387 | 439 | 378 | 388 | 540 | 637 |
| 2019 | 520 | 461 | 334 | 424 | 414 | 366 | 441 | 423 | 427 | 302 | 405 | 593 |
| 2020 | 628 | 417 | 308 | 237 | 330 | 440 | 464 | 340 | 406 | 525 | 510 | 461 |
| 2021 | 492 | 248 | 360 | 379 | 470 | 454 | 411 | 451 | 426 | 466 | 533 | 554 |
| 2022 | -- | -- | -- | -- | -- | -- | -- | -- | -- | -- | -- | -- |
| 2023 | -- | -- | -- | -- | -- | -- | -- | -- | -- | -- | -- | -- |
| 2024 | -- | |||||||||||
| - = No Data Reported; -- = Not Applicable; NA = Not Available; W = Withheld to avoid disclosure of individual company data. |
| Release Date: 3/29/2024 |
| Next Release Date: 4/30/2024 |