|
Download Data (XLS File) |
|
||||||||
|
||||||||
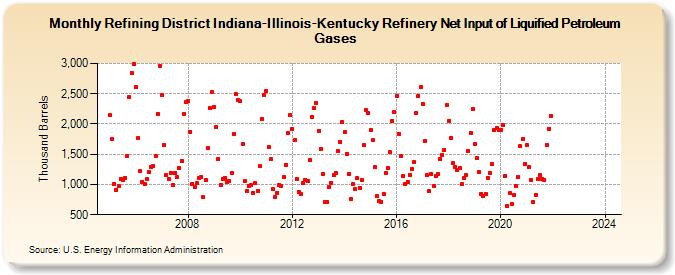
| Refining District Indiana-Illinois-Kentucky Refinery Net Input of Liquified Petroleum Gases (Thousand Barrels) | ||||||||
| Year | Jan | Feb | Mar | Apr | May | Jun | Jul | Aug | Sep | Oct | Nov | Dec |
|---|---|---|---|---|---|---|---|---|---|---|---|---|
| 2005 | 2,144 | 1,749 | 1,006 | 916 | 972 | 1,098 | 1,079 | 1,115 | 1,478 | 2,439 | 2,846 | 2,987 |
| 2006 | 2,604 | 1,761 | 1,216 | 1,047 | 1,007 | 1,083 | 1,198 | 1,293 | 1,311 | 1,472 | 2,170 | 2,963 |
| 2007 | 2,473 | 1,656 | 1,156 | 1,084 | 1,197 | 999 | 1,195 | 1,116 | 1,265 | 1,388 | 2,173 | 2,358 |
| 2008 | 2,379 | 1,872 | 1,016 | 952 | 1,025 | 1,102 | 1,125 | 786 | 1,071 | 1,601 | 2,263 | 2,535 |
| 2009 | 2,287 | 1,951 | 1,429 | 998 | 1,093 | 1,112 | 1,039 | 1,056 | 1,196 | 1,840 | 2,495 | 2,396 |
| 2010 | 2,373 | 1,664 | 1,050 | 890 | 979 | 986 | 864 | 1,022 | 896 | 1,299 | 2,086 | 2,487 |
| 2011 | 2,550 | 1,622 | 1,413 | 920 | 789 | 860 | 991 | 980 | 1,118 | 1,329 | 1,848 | 2,143 |
| 2012 | 1,918 | 1,733 | 1,091 | 870 | 836 | 1,026 | 1,080 | 1,056 | 1,407 | 2,119 | 2,257 | 2,346 |
| 2013 | 1,887 | 1,587 | 1,175 | 707 | 717 | 950 | 1,032 | 1,150 | 1,192 | 1,552 | 1,699 | 2,033 |
| 2014 | 1,862 | 1,509 | 1,180 | 760 | 1,002 | 922 | 1,099 | 948 | 1,068 | 1,645 | 2,223 | 2,178 |
| 2015 | 1,894 | 1,728 | 1,284 | 804 | 725 | 717 | 844 | 1,189 | 1,271 | 1,529 | 2,056 | 2,206 |
| 2016 | 2,459 | 1,835 | 1,463 | 1,146 | 1,014 | 1,047 | 1,161 | 1,254 | 1,366 | 2,185 | 2,465 | 2,603 |
| 2017 | 2,331 | 1,712 | 1,152 | 884 | 1,177 | 975 | 1,135 | 1,172 | 1,420 | 1,494 | 1,576 | 2,308 |
| 2018 | 2,054 | 1,773 | 1,350 | 1,295 | 1,237 | 1,278 | 1,003 | 1,109 | 1,153 | 1,554 | 1,857 | 2,248 |
| 2019 | 1,668 | 1,437 | 1,203 | 843 | 804 | 849 | 1,114 | 1,193 | 1,335 | 1,895 | 1,933 | 1,902 |
| 2020 | 1,905 | 1,980 | 1,143 | 642 | 851 | 674 | 825 | 978 | 1,125 | 1,628 | 1,759 | 1,339 |
| 2021 | 1,647 | 1,281 | 1,080 | 705 | 825 | 1,096 | 1,154 | 1,098 | 1,079 | 1,654 | 1,920 | 2,129 |
| 2022 | -- | -- | -- | -- | -- | -- | -- | -- | -- | -- | -- | -- |
| 2023 | -- | -- | -- | -- | -- | -- | -- | -- | -- | -- | -- | -- |
| 2024 | -- | |||||||||||
| - = No Data Reported; -- = Not Applicable; NA = Not Available; W = Withheld to avoid disclosure of individual company data. |
| Release Date: 3/29/2024 |
| Next Release Date: 4/30/2024 |