|
Download Data (XLS File) |
|
||||||||
|
||||||||
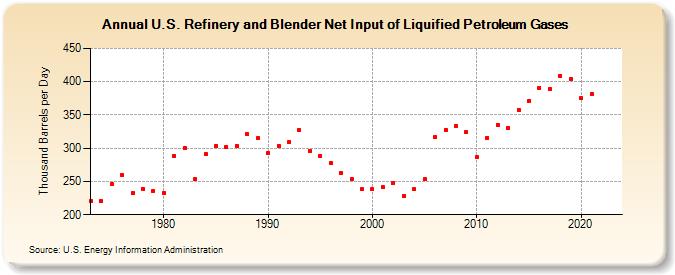
| U.S. Refinery and Blender Net Input of Liquified Petroleum Gases (Thousand Barrels per Day) | ||||||||
| Decade | Year-0 | Year-1 | Year-2 | Year-3 | Year-4 | Year-5 | Year-6 | Year-7 | Year-8 | Year-9 |
|---|---|---|---|---|---|---|---|---|---|---|
| 1970's | 220 | 220 | 246 | 260 | 233 | 239 | 236 | |||
| 1980's | 233 | 289 | 300 | 253 | 291 | 304 | 302 | 304 | 321 | 315 |
| 1990's | 293 | 304 | 309 | 327 | 296 | 289 | 278 | 263 | 253 | 238 |
| 2000's | 238 | 241 | 247 | 228 | 238 | 253 | 317 | 328 | 334 | 324 |
| 2010's | 287 | 316 | 335 | 331 | 358 | 371 | 391 | 389 | 409 | 404 |
| 2020's | 375 | 382 | -- | -- |
| - = No Data Reported; -- = Not Applicable; NA = Not Available; W = Withheld to avoid disclosure of individual company data. |
| Release Date: 3/29/2024 |
| Next Release Date: 8/30/2024 |