|
Download Data (XLS File) |
|
||||||||
|
||||||||
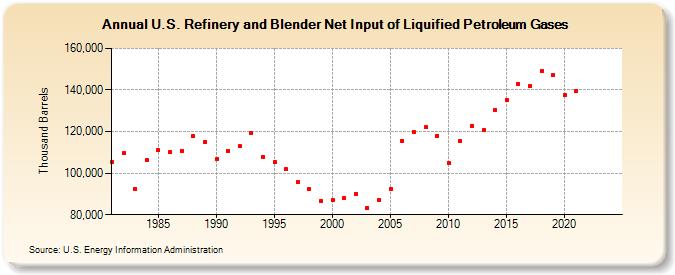
| U.S. Refinery and Blender Net Input of Liquified Petroleum Gases (Thousand Barrels) | ||||||||
| Decade | Year-0 | Year-1 | Year-2 | Year-3 | Year-4 | Year-5 | Year-6 | Year-7 | Year-8 | Year-9 |
|---|---|---|---|---|---|---|---|---|---|---|
| 1980's | 105,439 | 109,623 | 92,436 | 106,386 | 110,998 | 110,259 | 110,880 | 117,664 | 115,020 | |
| 1990's | 106,779 | 110,874 | 112,948 | 119,461 | 107,867 | 105,336 | 101,814 | 95,819 | 92,294 | 86,782 |
| 2000's | 87,039 | 87,956 | 89,980 | 83,254 | 87,244 | 92,437 | 115,612 | 119,780 | 122,062 | 118,094 |
| 2010's | 104,793 | 115,499 | 122,674 | 120,718 | 130,564 | 135,257 | 143,027 | 142,139 | 149,284 | 147,301 |
| 2020's | 137,369 | 139,586 | -- | -- |
| - = No Data Reported; -- = Not Applicable; NA = Not Available; W = Withheld to avoid disclosure of individual company data. |
| Release Date: 3/29/2024 |
| Next Release Date: 8/30/2024 |