|
Download Data (XLS File) |
|
||||||||
|
||||||||
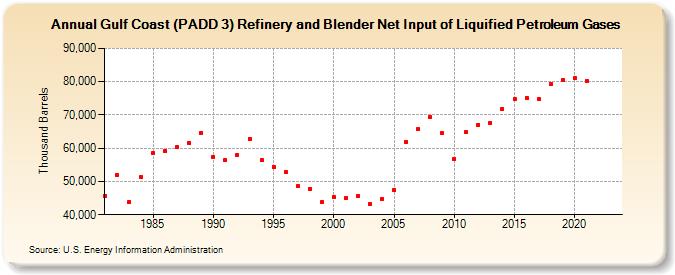
| Gulf Coast (PADD 3) Refinery and Blender Net Input of Liquified Petroleum Gases (Thousand Barrels) | ||||||||
| Decade | Year-0 | Year-1 | Year-2 | Year-3 | Year-4 | Year-5 | Year-6 | Year-7 | Year-8 | Year-9 |
|---|---|---|---|---|---|---|---|---|---|---|
| 1980's | 45,772 | 51,950 | 43,792 | 51,312 | 58,557 | 59,291 | 60,231 | 61,572 | 64,631 | |
| 1990's | 57,435 | 56,405 | 58,098 | 62,865 | 56,478 | 54,457 | 52,705 | 48,682 | 47,824 | 43,795 |
| 2000's | 45,300 | 45,026 | 45,738 | 43,260 | 44,765 | 47,466 | 61,953 | 65,701 | 69,445 | 64,476 |
| 2010's | 56,801 | 64,797 | 66,983 | 67,698 | 71,755 | 74,684 | 75,136 | 74,855 | 79,288 | 80,625 |
| 2020's | 81,166 | 80,202 | -- | -- |
| - = No Data Reported; -- = Not Applicable; NA = Not Available; W = Withheld to avoid disclosure of individual company data. |
| Release Date: 3/29/2024 |
| Next Release Date: 8/30/2024 |