|
Download Data (XLS File) |
|
||||||||
|
||||||||
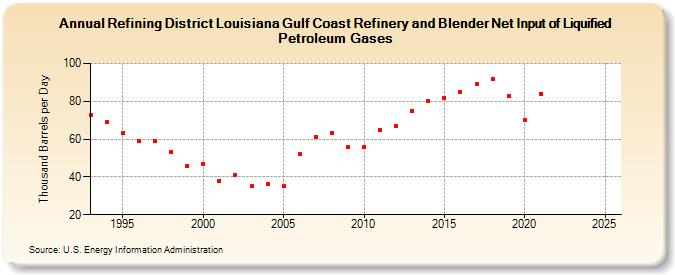
| Refining District Louisiana Gulf Coast Refinery and Blender Net Input of Liquified Petroleum Gases (Thousand Barrels per Day) | ||||||||
| Decade | Year-0 | Year-1 | Year-2 | Year-3 | Year-4 | Year-5 | Year-6 | Year-7 | Year-8 | Year-9 |
|---|---|---|---|---|---|---|---|---|---|---|
| 1990's | 73 | 69 | 63 | 59 | 59 | 53 | 46 | |||
| 2000's | 47 | 38 | 41 | 35 | 36 | 35 | 52 | 61 | 63 | 56 |
| 2010's | 56 | 65 | 67 | 75 | 80 | 82 | 85 | 89 | 92 | 83 |
| 2020's | 70 | 84 | -- | -- |
| - = No Data Reported; -- = Not Applicable; NA = Not Available; W = Withheld to avoid disclosure of individual company data. |
| Release Date: 8/30/2024 |
| Next Release Date: 8/29/2025 |