|
Download Data (XLS File) |
|
||||||||
|
||||||||
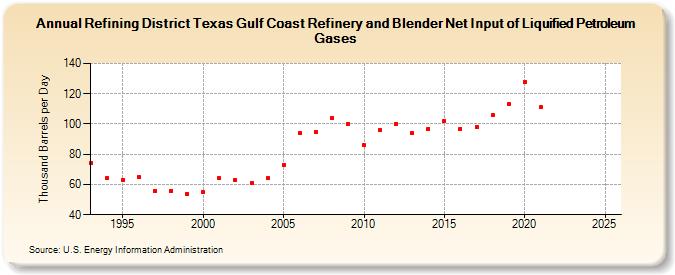
| Refining District Texas Gulf Coast Refinery and Blender Net Input of Liquified Petroleum Gases (Thousand Barrels per Day) | ||||||||
| Decade | Year-0 | Year-1 | Year-2 | Year-3 | Year-4 | Year-5 | Year-6 | Year-7 | Year-8 | Year-9 |
|---|---|---|---|---|---|---|---|---|---|---|
| 1990's | 74 | 64 | 63 | 65 | 56 | 56 | 54 | |||
| 2000's | 55 | 64 | 63 | 61 | 64 | 73 | 94 | 95 | 104 | 100 |
| 2010's | 86 | 96 | 100 | 94 | 97 | 102 | 97 | 98 | 106 | 113 |
| 2020's | 128 | 111 | -- | -- |
| - = No Data Reported; -- = Not Applicable; NA = Not Available; W = Withheld to avoid disclosure of individual company data. |
| Release Date: 3/29/2024 |
| Next Release Date: 8/30/2024 |