|
Download Data (XLS File) |
|
||||||||
|
||||||||
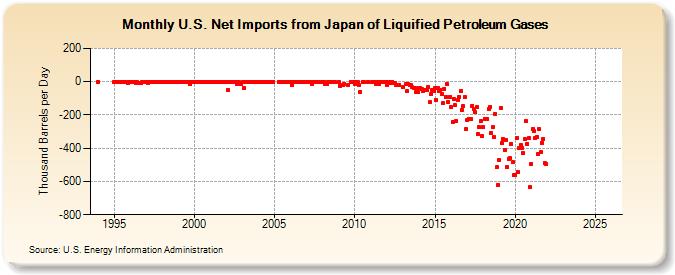
| U.S. Net Imports from Japan of Liquified Petroleum Gases (Thousand Barrels per Day) | ||||||||
| Year | Jan | Feb | Mar | Apr | May | Jun | Jul | Aug | Sep | Oct | Nov | Dec |
|---|---|---|---|---|---|---|---|---|---|---|---|---|
| 1994 | 0 | |||||||||||
| 1995 | 0 | 0 | 0 | 0 | 0 | 0 | 0 | 0 | 0 | 0 | -10 | 0 |
| 1996 | 0 | 0 | 0 | 0 | -10 | 0 | -10 | -9 | -10 | 0 | 0 | 0 |
| 1997 | 0 | -6 | 0 | -2 | 0 | -1 | 0 | 0 | 0 | 0 | 0 | 0 |
| 1998 | 0 | 0 | 0 | -4 | 0 | 0 | 0 | 0 | 0 | -1 | 0 | 0 |
| 1999 | 0 | -5 | 0 | 0 | 0 | 0 | 0 | 0 | 0 | -16 | 0 | 0 |
| 2000 | 0 | 0 | 0 | 0 | 0 | 0 | 0 | 0 | 0 | 0 | 0 | 0 |
| 2001 | 0 | 0 | 0 | 0 | 0 | 0 | 0 | 0 | 0 | 0 | 0 | -3 |
| 2002 | 0 | -50 | 0 | 0 | 0 | 0 | 0 | -5 | -16 | 0 | -17 | -13 |
| 2003 | -4 | -37 | 0 | 0 | 0 | -2 | 0 | 0 | 0 | 0 | 0 | 0 |
| 2004 | 0 | 0 | 0 | 0 | 0 | 0 | 0 | 0 | 0 | 0 | 0 | 0 |
| 2005 | 0 | 0 | 0 | 0 | 0 | 0 | 0 | |||||
| 2006 | 0 | -18 | 0 | 0 | 0 | 0 | 0 | 0 | 0 | 0 | 0 | |
| 2007 | 0 | 0 | 0 | -14 | 0 | 0 | 0 | 0 | 0 | |||
| 2008 | 0 | 0 | -15 | -15 | 0 | 0 | 0 | 0 | ||||
| 2009 | 0 | -26 | -18 | -13 | -18 | 0 | 0 | 0 | ||||
| 2010 | -17 | 0 | 0 | -18 | -62 | 0 | 0 | 0 | ||||
| 2011 | 0 | 0 | 0 | -14 | 0 | -15 | 0 | 0 | 0 | |||
| 2012 | -18 | 0 | 0 | -9 | 0 | -8 | -18 | -18 | -18 | |||
| 2013 | -35 | -17 | -57 | -17 | -19 | -19 | -35 | -38 | -37 | -63 | -63 | |
| 2014 | -36 | -39 | -45 | -57 | -49 | -51 | -52 | -32 | -125 | -73 | -51 | -54 |
| 2015 | -37 | -111 | -37 | -59 | -49 | -72 | -129 | -43 | -90 | -17 | -123 | -90 |
| 2016 | -153 | -240 | -105 | -142 | -238 | -112 | -92 | -55 | -169 | -148 | -93 | -287 |
| 2017 | -230 | -222 | -226 | -225 | -144 | -164 | -184 | -153 | -315 | -275 | -239 | -324 |
| 2018 | -275 | -222 | -226 | -223 | -166 | -153 | -310 | -275 | -335 | -193 | -515 | -620 |
| 2019 | -470 | -156 | -368 | -346 | -410 | -350 | -516 | -465 | -461 | -375 | -486 | -563 |
| 2020 | -563 | -340 | -544 | -396 | -382 | -398 | -429 | -346 | -237 | -373 | -339 | -634 |
| 2021 | -493 | -285 | -298 | -339 | -332 | -436 | -287 | -425 | -367 | -346 | -491 | -497 |
| 2022 | -- | -- | -- | -- | -- | -- | -- | -- | -- | -- | -- | -- |
| 2023 | -- | -- | -- | -- | -- | -- | -- | -- | -- | -- | -- | -- |
| 2024 | -- | |||||||||||
| - = No Data Reported; -- = Not Applicable; NA = Not Available; W = Withheld to avoid disclosure of individual company data. |
| Release Date: 3/29/2024 |
| Next Release Date: 4/30/2024 |