|
Download Data (XLS File) |
|
||||||||
|
||||||||
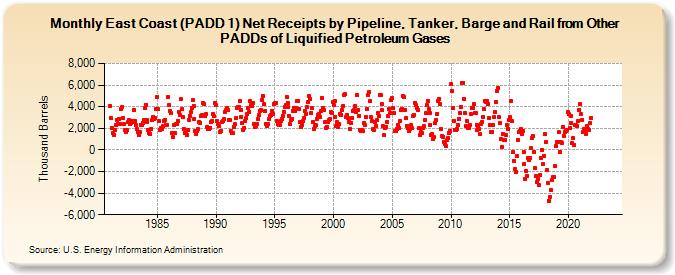
| East Coast (PADD 1) Net Receipts by Pipeline, Tanker, Barge and Rail from Other PADDs of Liquified Petroleum Gases (Thousand Barrels) | ||||||||
| Year | Jan | Feb | Mar | Apr | May | Jun | Jul | Aug | Sep | Oct | Nov | Dec |
|---|---|---|---|---|---|---|---|---|---|---|---|---|
| 1981 | 4,083 | 2,925 | 1,987 | 1,524 | 1,403 | 1,886 | 2,314 | 2,810 | 2,419 | 2,863 | 2,428 | 3,795 |
| 1982 | 3,934 | 2,975 | 2,397 | 1,807 | 1,636 | 1,798 | 2,588 | 2,793 | 2,387 | 2,521 | 2,681 | 2,554 |
| 1983 | 3,724 | 2,721 | 2,264 | 1,937 | 1,692 | 1,336 | 1,660 | 2,307 | 2,311 | 2,511 | 2,732 | 3,866 |
| 1984 | 4,195 | 2,786 | 2,577 | 1,807 | 1,572 | 1,487 | 1,933 | 2,781 | 3,023 | 2,864 | 2,968 | 3,764 |
| 1985 | 4,874 | 3,754 | 2,654 | 1,858 | 2,033 | 1,936 | 2,199 | 2,704 | 2,805 | 2,347 | 2,332 | 4,922 |
| 1986 | 4,191 | 3,642 | 3,394 | 1,586 | 1,220 | 2,291 | 1,600 | 2,391 | 2,408 | 2,676 | 3,522 | 3,217 |
| 1987 | 4,672 | 3,742 | 3,018 | 1,956 | 1,568 | 1,541 | 1,409 | 1,803 | 2,806 | 3,143 | 3,503 | 3,911 |
| 1988 | 4,586 | 4,102 | 2,896 | 1,715 | 1,517 | 1,726 | 1,932 | 2,564 | 2,514 | 3,132 | 3,192 | 4,385 |
| 1989 | 4,204 | 3,123 | 3,324 | 2,163 | 1,898 | 1,899 | 2,062 | 2,618 | 2,695 | 3,309 | 3,094 | 4,301 |
| 1990 | 4,149 | 2,651 | 2,359 | 2,197 | 1,641 | 1,754 | 2,599 | 2,697 | 2,881 | 3,549 | 3,666 | 3,837 |
| 1991 | 3,708 | 2,804 | 2,735 | 1,768 | 1,555 | 1,524 | 2,131 | 2,361 | 2,932 | 3,924 | 3,936 | 3,993 |
| 1992 | 4,496 | 3,704 | 3,086 | 2,467 | 1,820 | 2,060 | 2,710 | 2,975 | 3,293 | 3,864 | 3,551 | 4,498 |
| 1993 | 4,113 | 4,097 | 4,340 | 2,433 | 2,125 | 2,215 | 2,388 | 2,846 | 3,217 | 3,642 | 3,655 | 4,641 |
| 1994 | 4,993 | 4,212 | 3,566 | 2,382 | 2,236 | 2,356 | 2,858 | 3,114 | 3,273 | 3,642 | 3,332 | 4,235 |
| 1995 | 4,312 | 4,375 | 2,720 | 2,353 | 2,304 | 2,331 | 2,681 | 2,875 | 3,168 | 3,537 | 3,983 | 4,117 |
| 1996 | 4,918 | 4,379 | 3,942 | 3,094 | 2,353 | 2,728 | 2,881 | 3,557 | 3,851 | 3,609 | 3,923 | 4,502 |
| 1997 | 4,564 | 3,780 | 2,593 | 2,148 | 2,308 | 2,658 | 2,985 | 3,634 | 3,369 | 3,966 | 4,429 | 5,001 |
| 1998 | 4,737 | 3,394 | 3,897 | 2,562 | 1,948 | 2,175 | 2,284 | 2,882 | 3,193 | 3,300 | 3,086 | 3,589 |
| 1999 | 4,793 | 3,895 | 3,674 | 2,560 | 2,024 | 2,152 | 2,552 | 2,725 | 2,815 | 3,510 | 3,425 | 4,407 |
| 2000 | 4,196 | 4,501 | 3,026 | 2,253 | 2,557 | 2,112 | 2,375 | 3,362 | 3,240 | 3,657 | 4,067 | 5,126 |
| 2001 | 5,146 | 3,004 | 3,275 | 2,918 | 2,575 | 1,970 | 2,487 | 2,936 | 3,644 | 3,657 | 4,070 | 3,500 |
| 2002 | 5,094 | 3,690 | 3,130 | 1,875 | 1,754 | 1,888 | 1,737 | 2,503 | 2,303 | 3,042 | 3,801 | 5,054 |
| 2003 | 5,323 | 4,495 | 3,039 | 2,655 | 1,929 | 1,799 | 2,572 | 2,200 | 2,740 | 3,408 | 3,155 | 5,094 |
| 2004 | 5,094 | 4,290 | 3,656 | 2,181 | 1,362 | 2,069 | 2,153 | 2,586 | 3,104 | 3,812 | 3,447 | 4,605 |
| 2005 | 4,788 | 3,854 | 3,416 | 1,741 | 1,745 | 1,956 | 2,331 | 2,055 | 2,645 | 3,687 | 3,827 | 4,949 |
| 2006 | 4,859 | 3,739 | 2,922 | 2,221 | 1,991 | 1,744 | 1,938 | 2,275 | 2,020 | 3,147 | 3,259 | 4,320 |
| 2007 | 4,119 | 3,859 | 3,693 | 2,022 | 1,395 | 1,671 | 1,567 | 2,023 | 2,186 | 2,750 | 3,391 | 4,170 |
| 2008 | 4,559 | 3,744 | 3,439 | 2,264 | 1,405 | 1,471 | 984 | 1,170 | 2,482 | 2,782 | 3,362 | 4,545 |
| 2009 | 4,758 | 4,239 | 1,947 | 1,303 | 1,184 | 699 | 540 | 334 | 903 | 1,142 | 1,609 | 1,726 |
| 2010 | 6,085 | 5,458 | 3,868 | 2,678 | 1,845 | 1,799 | 1,957 | 2,324 | 2,891 | 3,448 | 3,990 | 6,194 |
| 2011 | 6,224 | 4,723 | 3,432 | 2,222 | 2,695 | 1,996 | 2,050 | 2,270 | 3,301 | 3,900 | 3,916 | 4,240 |
| 2012 | 3,436 | 3,412 | 2,305 | 1,864 | 2,228 | 1,929 | 1,469 | 2,365 | 2,598 | 3,057 | 3,792 | 4,558 |
| 2013 | 4,463 | 4,510 | 4,274 | 2,960 | 2,294 | 1,681 | 1,691 | 2,260 | 3,004 | 3,504 | 4,435 | 5,455 |
| 2014 | 5,773 | 3,004 | 2,490 | 1,021 | 275 | 1,479 | 882 | 934 | 1,379 | 2,327 | 1,972 | 2,783 |
| 2015 | 3,004 | 4,501 | 2,664 | -234 | -987 | -1,771 | -2,003 | -526 | 953 | 1,623 | 1,771 | 1,937 |
| 2016 | 1,441 | 1,766 | -212 | -1,328 | -2,689 | -1,944 | -2,375 | -785 | -972 | -716 | 149 | 1,139 |
| 2017 | 1,288 | -203 | -1,690 | -2,448 | -2,996 | -2,727 | -3,294 | -2,294 | -747 | 13 | -1,326 | -520 |
| 2018 | 1,470 | 768 | -1,878 | -3,085 | -4,686 | -4,341 | -3,732 | -2,748 | -2,520 | -2,504 | -1,530 | 337 |
| 2019 | 736 | 690 | 1,622 | -217 | 730 | 672 | 2,107 | 1,241 | 1,684 | 1,794 | 1,857 | 3,514 |
| 2020 | 3,322 | 2,021 | 3,094 | 2,498 | 628 | 1,123 | 460 | 2,335 | 2,275 | 2,186 | 2,712 | 3,706 |
| 2021 | 4,211 | 3,298 | 2,786 | 1,659 | 1,941 | 1,798 | 1,499 | 2,225 | 1,970 | 1,881 | 2,449 | 2,970 |
| 2022 | -- | -- | -- | -- | -- | -- | -- | -- | -- | -- | -- | -- |
| 2023 | -- | -- | -- | -- | -- | -- | -- | -- | -- | -- | -- | -- |
| 2024 | -- | |||||||||||
| - = No Data Reported; -- = Not Applicable; NA = Not Available; W = Withheld to avoid disclosure of individual company data. |
| Release Date: 3/29/2024 |
| Next Release Date: 4/30/2024 |
Referring Pages: