|
Download Data (XLS File) |
|
||||||||
|
||||||||
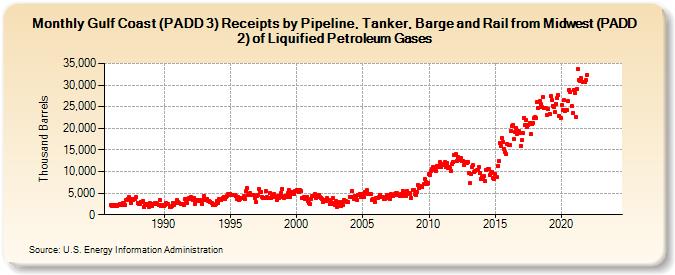
| Gulf Coast (PADD 3) Receipts by Pipeline, Tanker, Barge and Rail from Midwest (PADD 2) of Liquified Petroleum Gases (Thousand Barrels) | ||||||||
| Year | Jan | Feb | Mar | Apr | May | Jun | Jul | Aug | Sep | Oct | Nov | Dec |
|---|---|---|---|---|---|---|---|---|---|---|---|---|
| 1986 | 2,218 | 2,121 | 2,330 | 2,009 | 2,177 | 2,096 | 2,180 | 2,177 | 2,440 | 2,210 | 2,351 | 2,628 |
| 1987 | 2,473 | 2,349 | 3,293 | 3,651 | 4,007 | 3,382 | 2,682 | 3,533 | 3,513 | 3,572 | 3,637 | 3,997 |
| 1988 | 2,715 | 2,499 | 2,387 | 3,055 | 2,850 | 3,166 | 1,845 | 2,307 | 2,414 | 2,366 | 1,842 | 2,734 |
| 1989 | 2,519 | 2,039 | 2,365 | 2,524 | 2,636 | 2,640 | 2,593 | 2,154 | 3,449 | 2,038 | 2,143 | 1,961 |
| 1990 | 2,115 | 2,335 | 2,716 | 2,489 | 2,441 | 1,714 | 1,886 | 2,025 | 2,647 | 2,347 | 2,736 | 2,782 |
| 1991 | 3,395 | 2,942 | 2,746 | 2,491 | 2,398 | 2,526 | 2,339 | 3,574 | 2,824 | 2,668 | 3,561 | 3,982 |
| 1992 | 4,073 | 3,619 | 3,431 | 3,840 | 2,509 | 3,448 | 3,422 | 3,235 | 3,465 | 3,118 | 2,575 | 3,468 |
| 1993 | 4,314 | 3,379 | 3,432 | 3,736 | 3,172 | 3,205 | 3,021 | 2,640 | 2,197 | 2,199 | 2,228 | 2,478 |
| 1994 | 3,170 | 2,599 | 3,716 | 3,520 | 3,367 | 3,808 | 4,074 | 3,614 | 4,056 | 4,234 | 4,778 | 4,719 |
| 1995 | 4,897 | 4,454 | 4,505 | 4,474 | 4,524 | 4,264 | 3,557 | 4,122 | 3,376 | 3,709 | 3,929 | 3,950 |
| 1996 | 4,241 | 3,565 | 5,403 | 6,091 | 4,567 | 4,682 | 4,960 | 4,650 | 4,649 | 4,584 | 3,873 | 2,948 |
| 1997 | 4,313 | 4,513 | 5,836 | 5,163 | 5,247 | 4,140 | 3,801 | 3,929 | 5,426 | 4,212 | 3,758 | 3,787 |
| 1998 | 5,010 | 3,857 | 4,509 | 4,204 | 4,751 | 4,189 | 3,337 | 4,221 | 3,979 | 4,390 | 5,099 | 6,033 |
| 1999 | 4,206 | 3,954 | 4,314 | 4,006 | 5,000 | 5,736 | 4,041 | 4,879 | 5,299 | 4,704 | 4,735 | 5,373 |
| 2000 | 5,676 | 5,749 | 5,252 | 5,652 | 5,508 | 3,904 | 3,818 | 4,052 | 3,679 | 4,020 | 3,076 | 2,719 |
| 2001 | 2,566 | 3,711 | 4,271 | 4,257 | 4,421 | 4,747 | 3,937 | 4,255 | 4,496 | 4,080 | 3,972 | 3,600 |
| 2002 | 2,965 | 3,260 | 3,487 | 3,139 | 3,832 | 3,294 | 2,417 | 2,876 | 2,465 | 3,958 | 2,704 | 2,199 |
| 2003 | 3,059 | 1,798 | 2,779 | 2,974 | 2,115 | 2,903 | 2,211 | 3,442 | 3,236 | 3,066 | 2,871 | 2,951 |
| 2004 | 4,192 | 4,019 | 5,382 | 3,995 | 3,669 | 4,410 | 4,202 | 3,386 | 4,491 | 4,809 | 4,069 | 4,440 |
| 2005 | 4,888 | 4,127 | 5,204 | 5,094 | 5,646 | 4,739 | 4,874 | 4,711 | 3,474 | 3,728 | 3,643 | 3,034 |
| 2006 | 3,833 | 3,979 | 3,936 | 4,122 | 4,626 | 4,155 | 4,167 | 3,722 | 3,743 | 3,972 | 4,467 | 4,184 |
| 2007 | 4,465 | 3,599 | 4,703 | 4,382 | 4,482 | 4,821 | 4,926 | 4,936 | 4,452 | 4,520 | 4,433 | 4,704 |
| 2008 | 5,577 | 4,389 | 5,047 | 4,326 | 5,377 | 5,065 | 5,096 | 4,908 | 3,934 | 5,725 | 5,752 | 4,742 |
| 2009 | 4,654 | 5,216 | 6,982 | 6,084 | 6,593 | 6,338 | 6,302 | 7,062 | 8,214 | 7,489 | 7,109 | 7,400 |
| 2010 | 9,340 | 9,293 | 10,056 | 10,661 | 11,100 | 10,261 | 10,166 | 11,356 | 10,949 | 11,314 | 12,087 | 11,076 |
| 2011 | 11,492 | 11,793 | 12,158 | 11,041 | 12,013 | 10,911 | 10,939 | 10,793 | 10,122 | 11,678 | 12,232 | 13,727 |
| 2012 | 13,963 | 12,455 | 13,299 | 12,589 | 12,976 | 13,208 | 12,371 | 12,481 | 11,595 | 12,122 | 12,082 | 12,195 |
| 2013 | 9,696 | 7,257 | 9,324 | 11,144 | 11,441 | 9,953 | 10,150 | 10,248 | 10,356 | 10,994 | 9,567 | 8,327 |
| 2014 | 8,773 | 8,609 | 8,867 | 7,789 | 10,330 | 10,485 | 10,565 | 9,281 | 9,676 | 9,914 | 8,500 | 8,173 |
| 2015 | 9,336 | 8,630 | 11,169 | 12,439 | 16,578 | 16,013 | 17,803 | 16,790 | 15,292 | 14,401 | 13,975 | 16,385 |
| 2016 | 16,155 | 16,159 | 19,401 | 20,442 | 20,816 | 17,465 | 19,240 | 20,150 | 18,718 | 19,274 | 18,921 | 15,916 |
| 2017 | 17,260 | 18,837 | 22,450 | 20,718 | 21,885 | 20,246 | 20,733 | 21,240 | 18,641 | 20,976 | 21,218 | 22,322 |
| 2018 | 22,565 | 22,351 | 25,975 | 24,796 | 26,258 | 25,529 | 24,944 | 27,232 | 24,582 | 24,735 | 24,644 | 23,065 |
| 2019 | 24,391 | 23,394 | 27,417 | 26,583 | 25,272 | 24,877 | 23,844 | 25,633 | 26,933 | 27,596 | 22,913 | 22,461 |
| 2020 | 25,333 | 24,136 | 26,476 | 23,974 | 24,197 | 24,146 | 26,345 | 28,938 | 28,362 | 25,155 | 23,637 | 28,894 |
| 2021 | 28,154 | 22,714 | 29,050 | 33,633 | 31,246 | 31,028 | 31,555 | 30,729 | 30,700 | 30,812 | 31,101 | 32,351 |
| 2022 | -- | -- | -- | -- | -- | -- | -- | -- | -- | -- | -- | -- |
| 2023 | -- | -- | -- | -- | -- | -- | -- | -- | -- | -- | -- | -- |
| 2024 | -- | |||||||||||
| - = No Data Reported; -- = Not Applicable; NA = Not Available; W = Withheld to avoid disclosure of individual company data. |
| Release Date: 3/29/2024 |
| Next Release Date: 4/30/2024 |